RAK7431 Quick Start Guide
Prerequisite
Before going through each and every step in the installation guide of the RAK7431 WisNode Bridge Serial, make sure to prepare the necessary items listed below:
Hardware Tools
- RAK7431 WisNode Bridge Serial
- Micro USB Cable
- Gateway in Range, for Testing
- A Windows/Mac OS/Linux Computer
Software Tools
Product Configuration
Typical Network Application
RAK7431 converts data from the RS485 protocol into LPWAN wireless messages and delivers it to a cloud server through an LPWAN gateway. Cloud servers can also proactively send data to RAK7431 for two-way data transmission. Using the RAK7431, you can convert data from a conventional RS485 wired network to a wireless network.
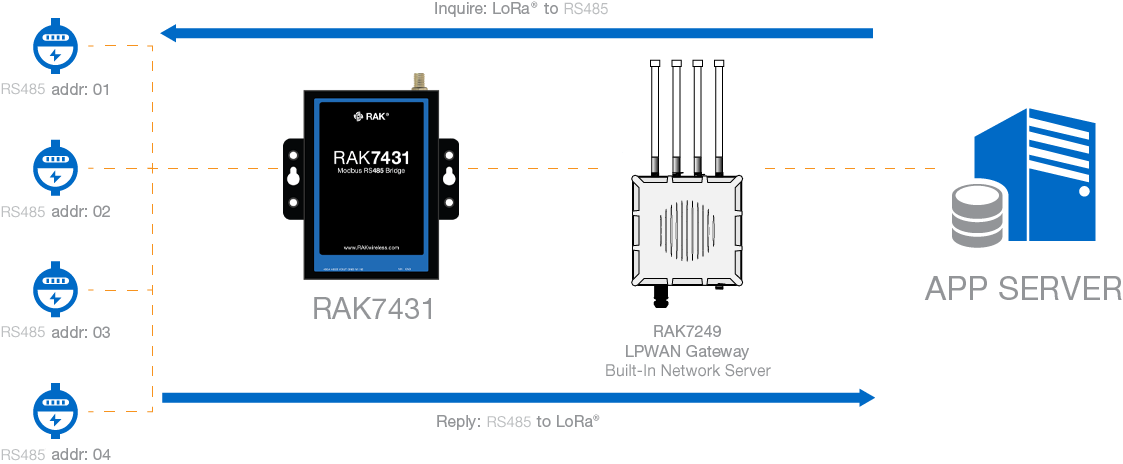 Figure 1: Example communication with RS485 enabled devices
Connect the RAK7431 to the Sensor
Power Interface Configuration
The RAK7431 device can be powered either by:
- DC (VIN/GND) terminals
- Micro USB
The DC screw terminals are supporting 8 to 48 VDC. The Micro USB port can be used to power the RAK7431, up to 5 V / 500 mA DC. At the same time, the USB port is used as the configuration port for the device. Using the USB cable to connect the RAK7431 to a computer’s USB port, you can import your configuration settings.
The Micro USB port can be used only for powering the device. It cannot provide power to VOUT and power other devices in the RS485 network.
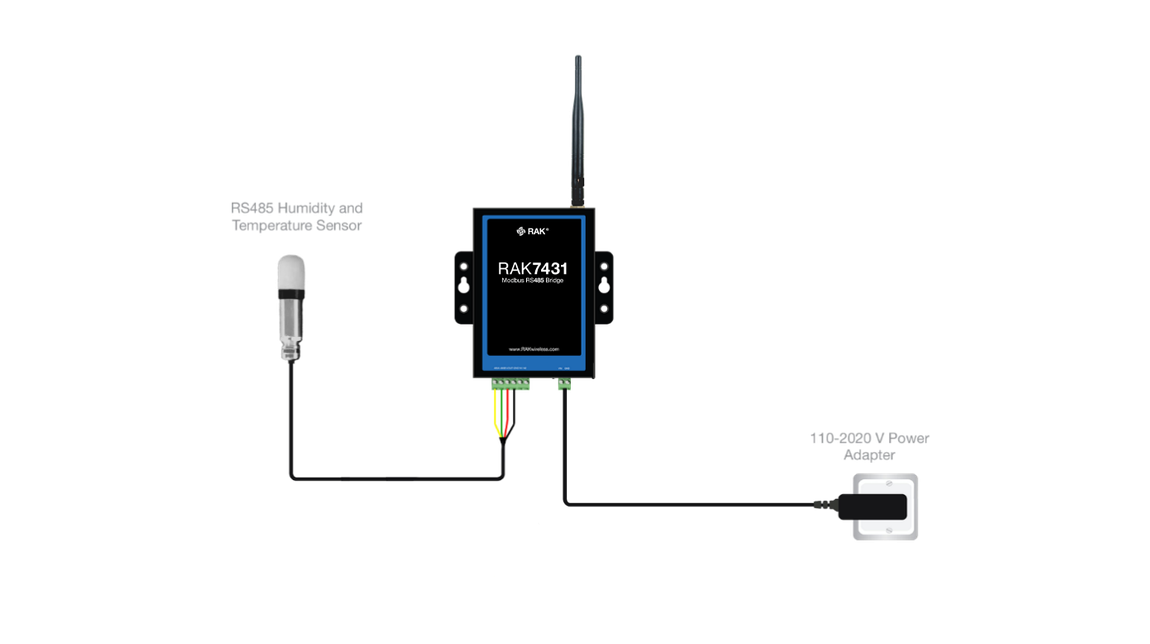 Figure 1: RAK7431 bridge with connected sensor and power supply
Data Interface Configuration
The RAK7431 - RS485 serial interface can support up to 16 RS485 devices. VOUT on the data interface can supply external power to the RS485 connected devices (only when the device is powered from the DC input). The VOUT output voltage is the same as the DC input voltage VIN.
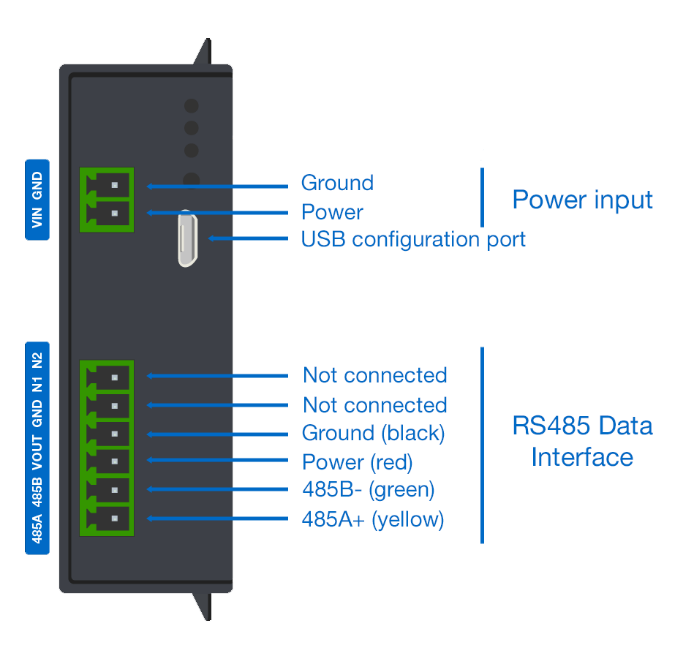 Figure 1: RAK7431 Interface pin definition
Gateway Connection Settings
In this section, the RAK7431 WisNode Bridge Serial will be connected into the RAKwireless Gateway. For this guide, the RAK7289 WisGate Edge Pro V2 shall be used. Listed below are the requisites for this section:
- RAK Serial Port Tool - used to configure the RAK7431 WisNode Bridge Serial
- WisGateOS 2 User Manual- guide on how to configure the RAK7289 WisGate Edge Pro V2
Gateway Configuration
Built-In Network Server Setup
- Start by accessing the gateway. You can see how to do it on the WisGateOS V2 user manual.
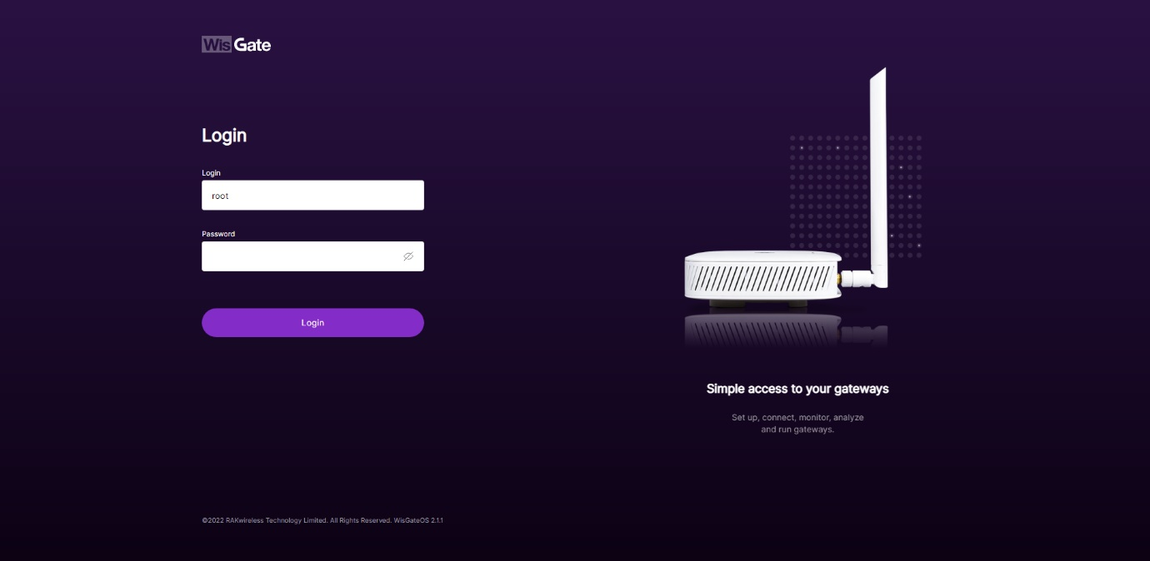 Figure 1: WisGateOS V2 login page
- Once logged in, head to the LoRa menu.
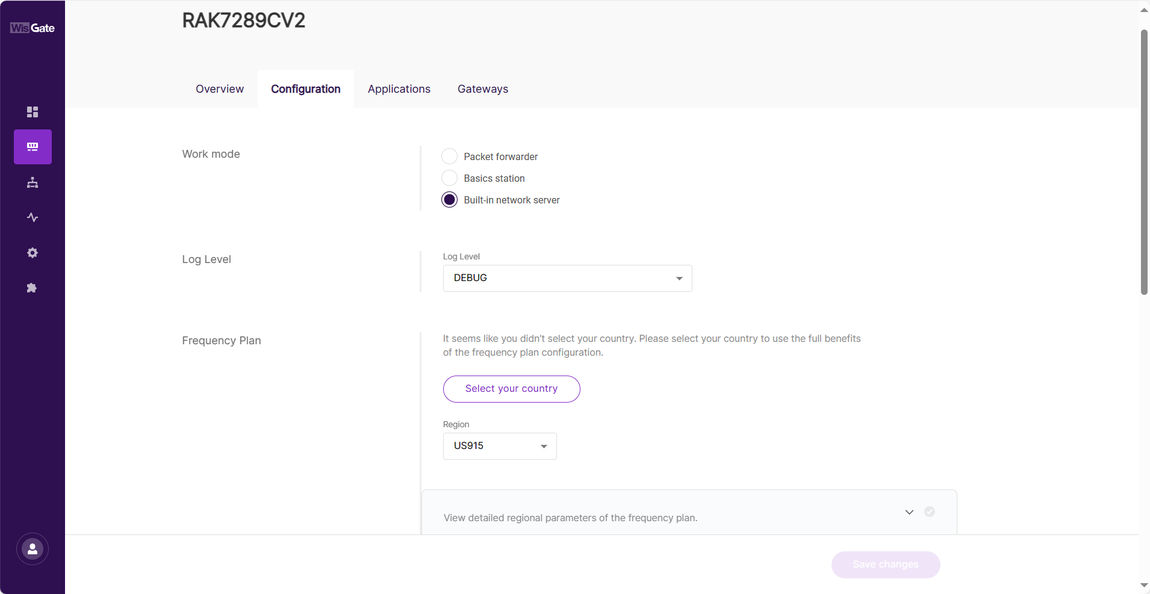 Figure 1: LoRa page
- By default, the gateway works as a Built-In Network Server. If that is not the case, check the Built-in Network Server Mode Settings on the WisGateOS V2 User manual to switch the mode.
Adding Application
- Once the gateway is in Built-in network server mode, head to the Applications tab.
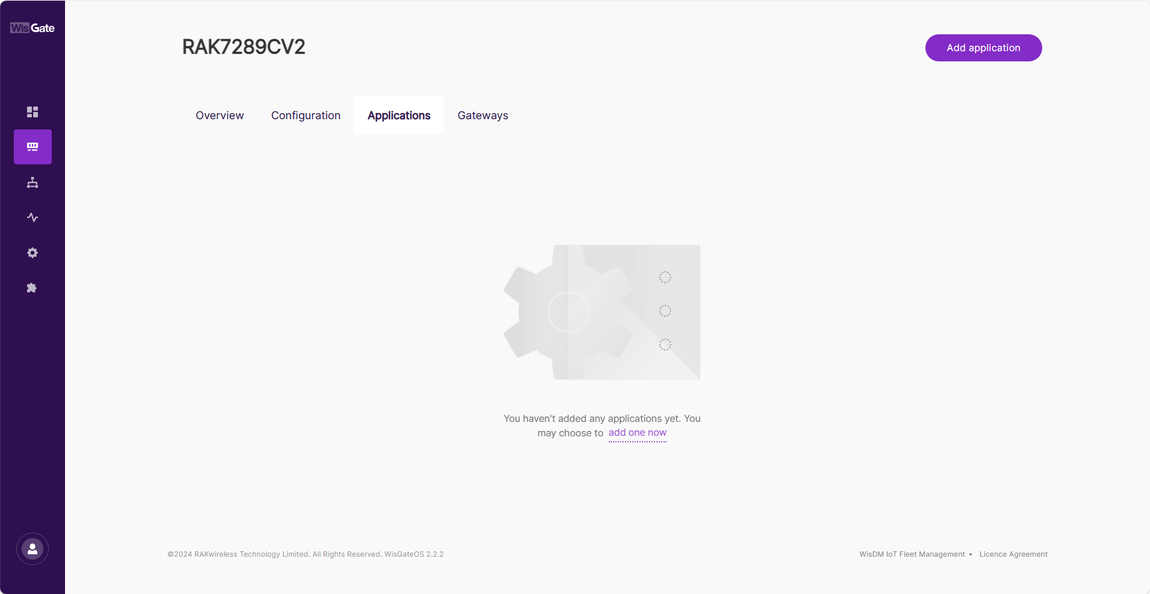 Figure 1: Create Application in the Built-In Network Server
- Click the Add application button or add one now link to add a new application. On the new page, fill in the following information:
- Application name - type a name for the application.
- Application description - optionally you can write a description of the application.
- Application Type - from the drop-down menu select the type of application.
- Unified Application key - all devices will use the same application key. Selecting this option pops up an Application Key field. You can type your application key there or use the Autogenerate button to generate one.
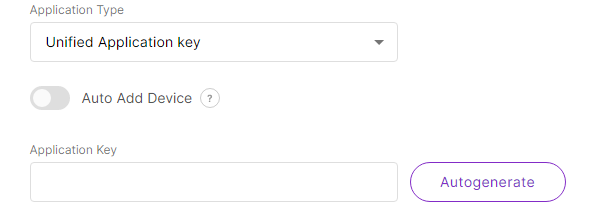 Figure 1: Unified application key
The Auto Add Device switch activates the Application EUI field. The device will be automatically added to the application after the application EUI and key verification.
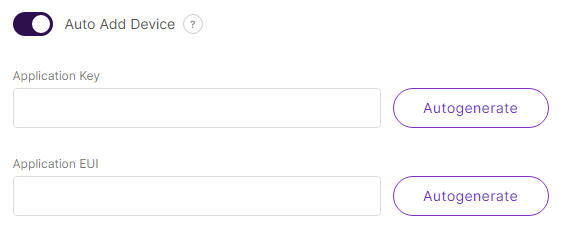 Figure 1: Auto add device
- Separate Application keys – each device will have its own application key. The key is added when registering the device.
- Payload type - from the drop-down, select CayenneLPP payload type and turn on the Only forward data object feature.
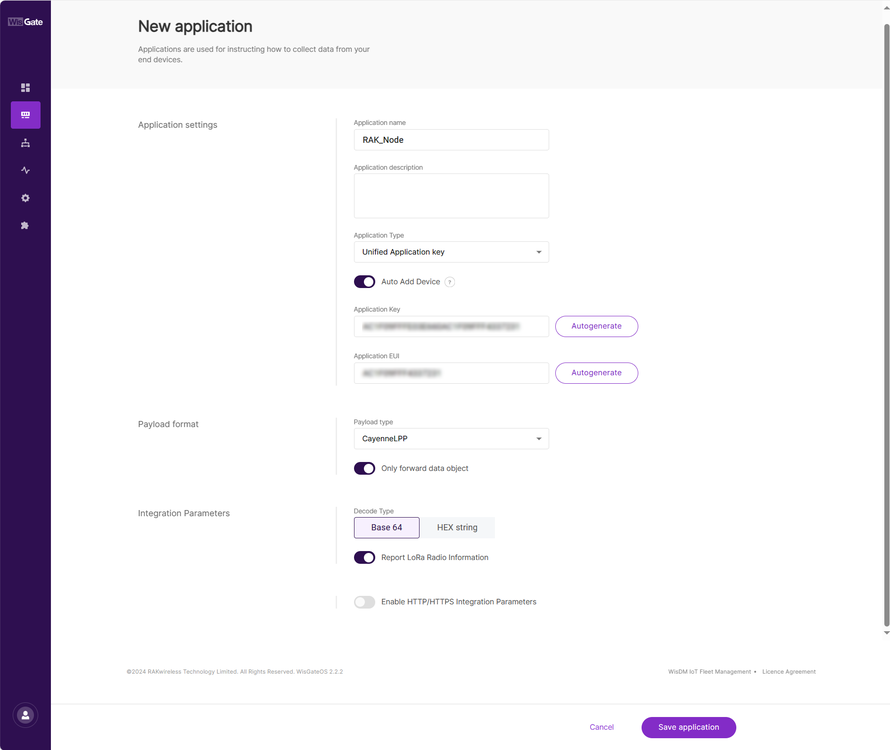 Figure 1: Adding application
- Once set, click Save application to add the application.
- After the application is added, head to the End devices tab. The devices should automatically register upon join request if you are using the Auto Add Device feature.
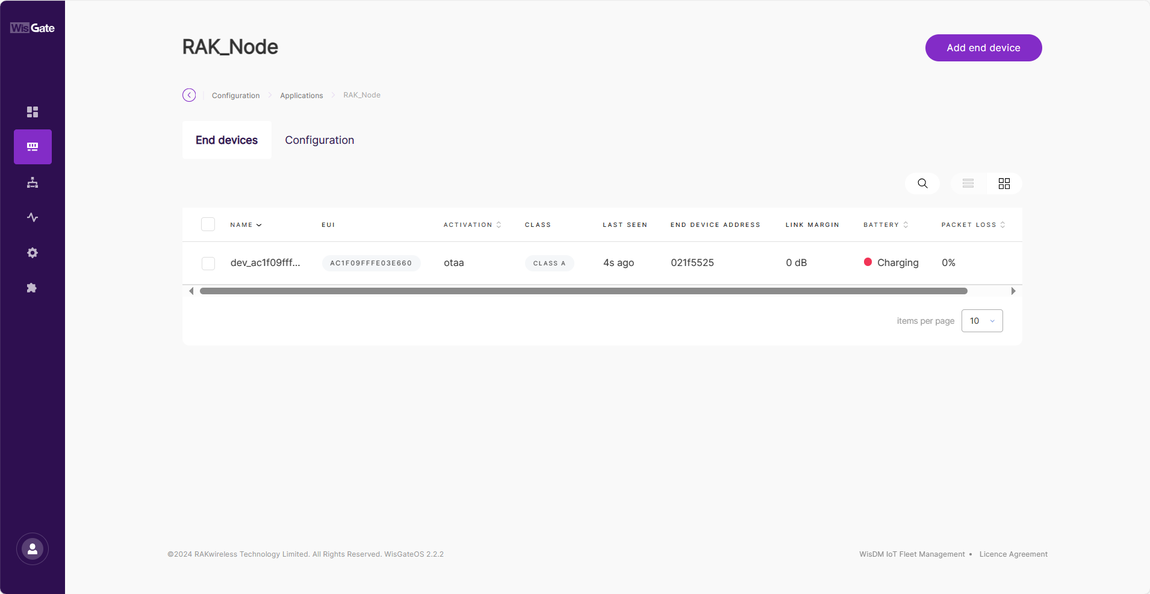 Figure 1: Successfully added end device
If that’s not the case, click the Add end device button. On the End device information page fill in the following information:
- Activation Mode - choose the activation mode of your device:
- OTAA
- ABP - This mode pops up two additional fields:
- Application Session Key
- Network Session Key
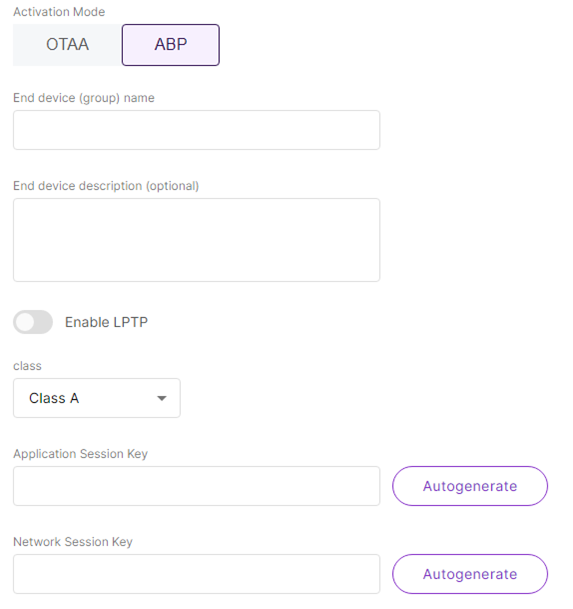 Figure 1: Adding ABP device
- End device (group) name – the name of the device.
- End device description (optional) – optionally, you can add a description for the device.
- Class – the class of the device.
- Frame Counter width – the width of the frame counter. Leave it as default.
- LoRaWAN MAC Version – the LoRaWAN MAC version. V1.0.2 pops up a LoRaWAN Regional Parameters reversion field where you need to select the reversion of the device.
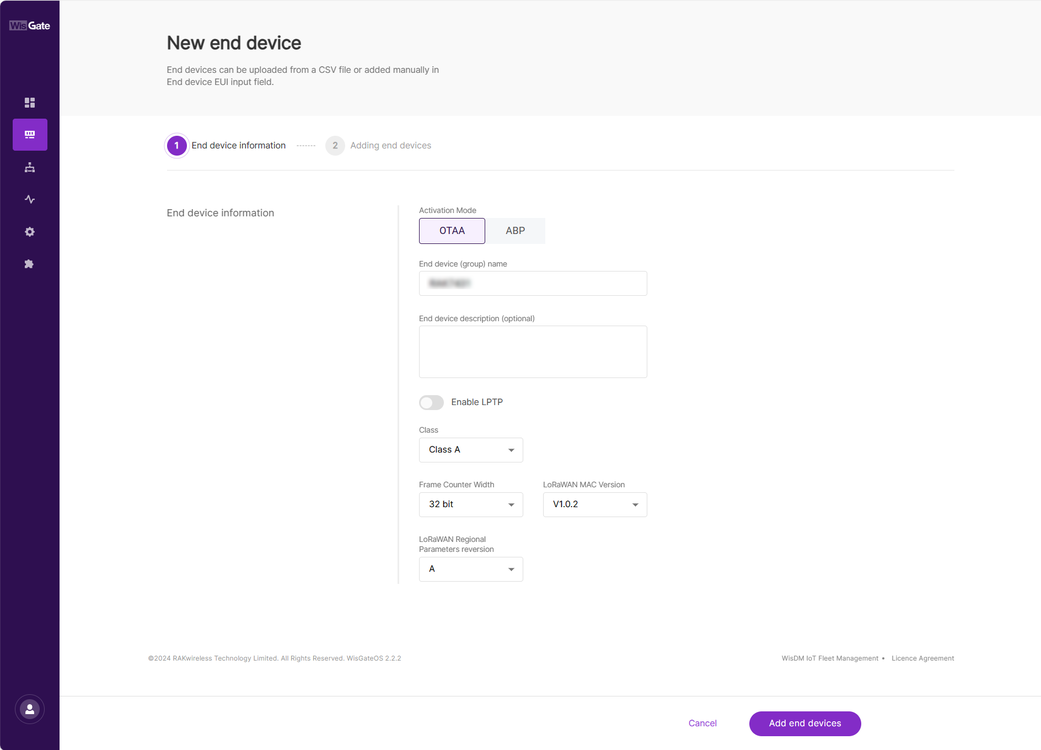 Figure 1: Successfully created application
Adding the Device
- Once everything is set, click Add end devices to go to the page and add the device.
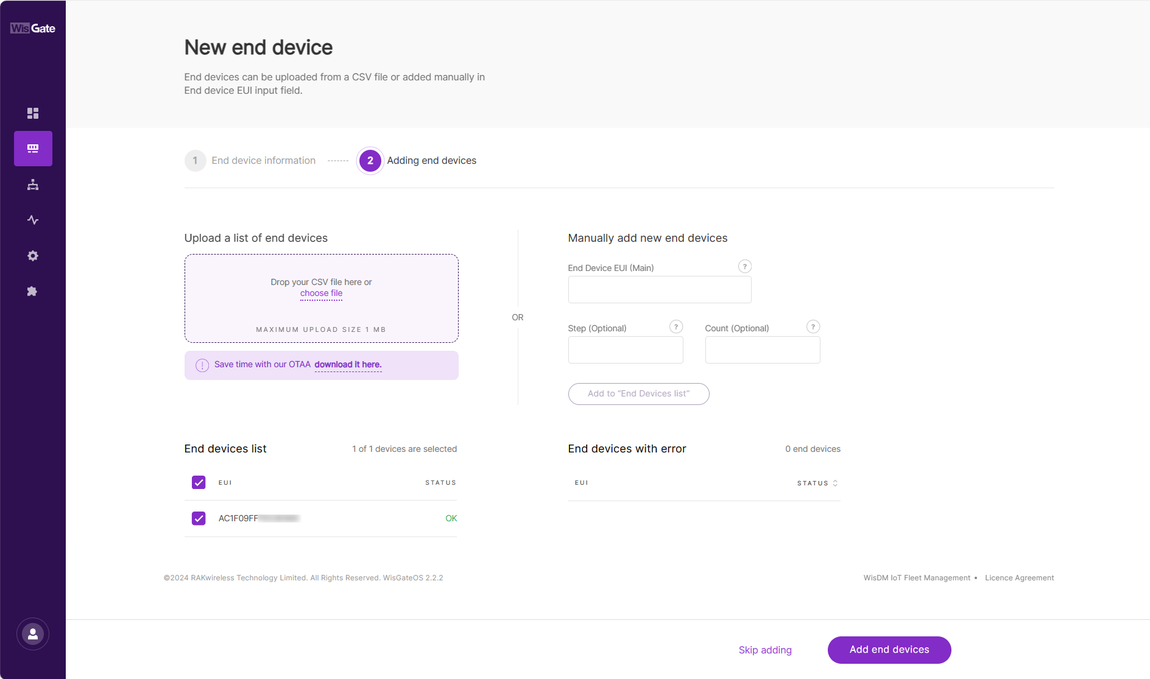 Figure 1: Adding end device
- On the Adding end devices page, type the device EUI at the End Device EUI (main) and click Add to “End Devices list”.
- If the EUI is correct, the device will show in the End devices list.
- If the EUI is not correct, the devices will show in the End devices with an error.
- Once the device is added to the End devices list click Add end devices. Confirm you are adding the device.
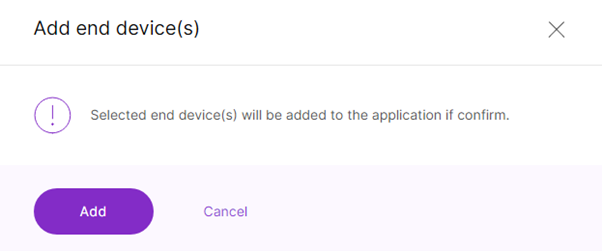 Figure 1: Confirmation message for adding a device
RAK7431 Configuration
Connect the RAK7431 to Your Network
- Connect the RAK7431 to a computer using the Micro USB cable.
- Open the RAK Serial Tool and select the correct COM port. The default baud rate is 115200.
- After selecting, press Open.
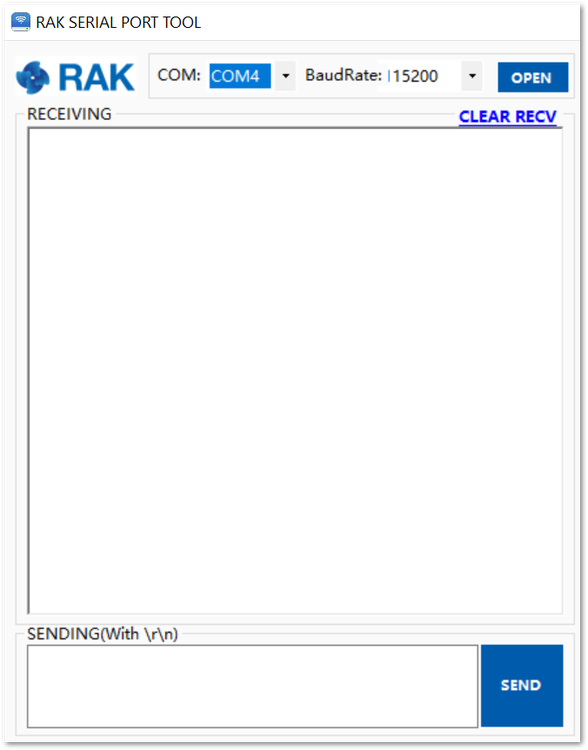 Figure 1: RAK Serial Tool
- To set up the Device EUI, run the command:
AT+DEVEUI=<Device EUI>
- To check the Device EUI run:
AT+DEVEUI
- To set up the Application EUI run the command:
AT+APPEUI=<application EUI>
- To set up the Application Key run the command:
AT+APPKEY=<application Key>
- To check the previously configured Application EUI and Key, run the commands:
AT+APPEUI
AT+APPKEY
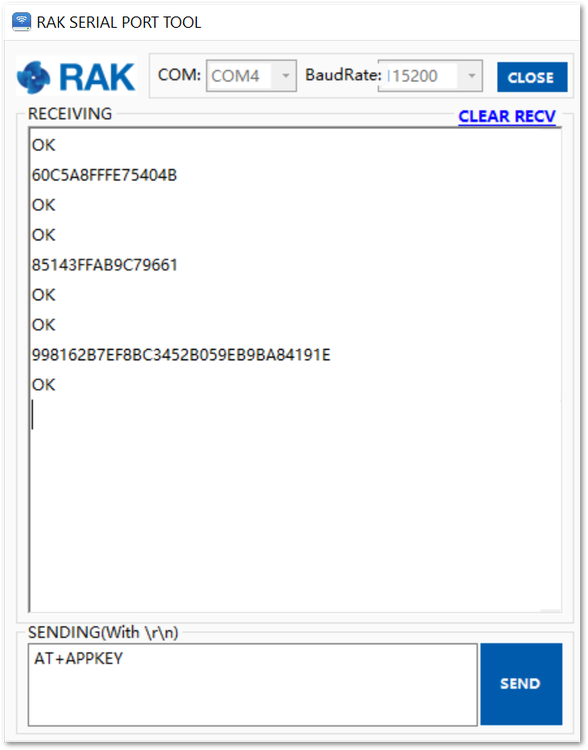 Figure 1: Configuring the RAK7431
Set the Frequency Region
The node supports the following Regional Frequencies:
- EU433
- CN470
- CN470ALI
- RU864
- IN865
- EU868
- US915
- AU915
- KR920
- AS923
For this demonstration, EU868 shall be used. To set the desired regional frequency band use the command:
AT+REGION=EU868
The regional frequency settings need to be consistent with the RAK commercial gateway supported band.
Data Serial Port Rate Setting
The baud rate setting needs to be consistent with the baud rate of the sensor, which is 9600.
The AT command for execution is:
AT+BAUDRATE=9600
Operating and Activation Mode Settings
- Supported operating modes are two: Class A and Class C. To set the operating mode (Class C in this case), you need to execute the AT command:
AT+CLASS=C
Changes will take effect as soon as they are made.
- Activation mode supports the following two modes: ABP and OTAA. To set the activation mode (OTAA in this case), you need to execute the AT command:
AT+JOINMODE=OTAA
- Restart is needed for the modification to take effect. To restart the RAK7431, execute the command:
AT+RESTART
- If everything is configured right, after the execution of the restart command this output pops up in the RAK Serial Tool:
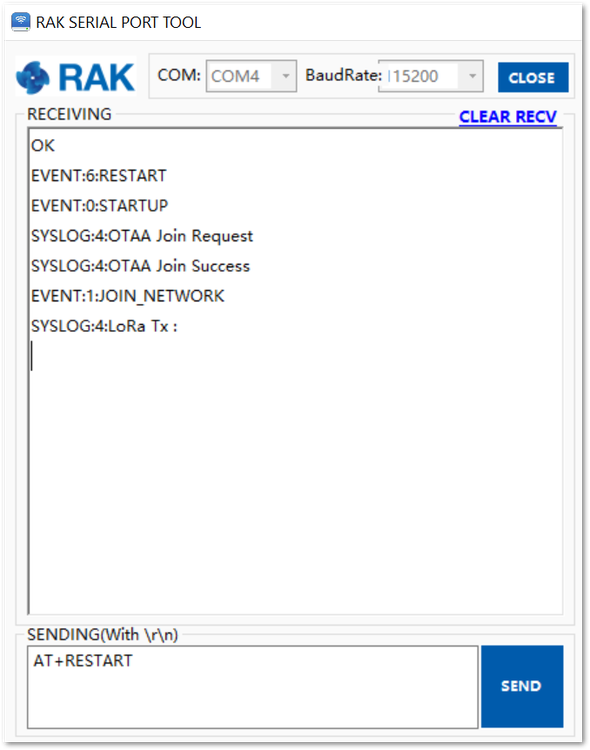 Figure 1: RAK7431 Successful Join
Configure RAK7431 Working Modes
Data Transparent Mode
When the RS485 data interface works in Modbus mode, the data encapsulation format can be divided into two types: transparent mode and non-transparent mode.
- In transparent mode, the Modbus execution instruction response data (data, received by the node) will be directly forwarded through the LoRaWAN network.
- In the non-transparent mode, the Modbus execution instruction response data (data, received by the node) will be encapsulated in the message header according to the Modbus protocol, and then transmitted to the server through LoRaWAN.
The non-transparent mode is the default one.
Enter the following AT command in the RAK Serial Tool to change the mode:
AT+TRANSPARENT=n
| n | Condition |
|---|---|
| 0 | transparent mode is turned off |
| 1 | it is turned on |
The change takes effect immediately after modification.
Scheduled Polling Function
When the device works in MODBUS mode, it supports the scheduled polling function.
This means that the device will perform a polling operation every given period (polling cycle). During polling, the device will send the pre-added MODBUS instructions in turn and forward the corresponding response data through the LoRaWAN network.
The device turns on the scheduled polling by default. The AT command for this is:
AT+ENABLEPOLL=n
| n | Condition |
|---|---|
| 0 | turns scheduled polling off |
| 1 | turns it on |
The modification takes effect after restart.
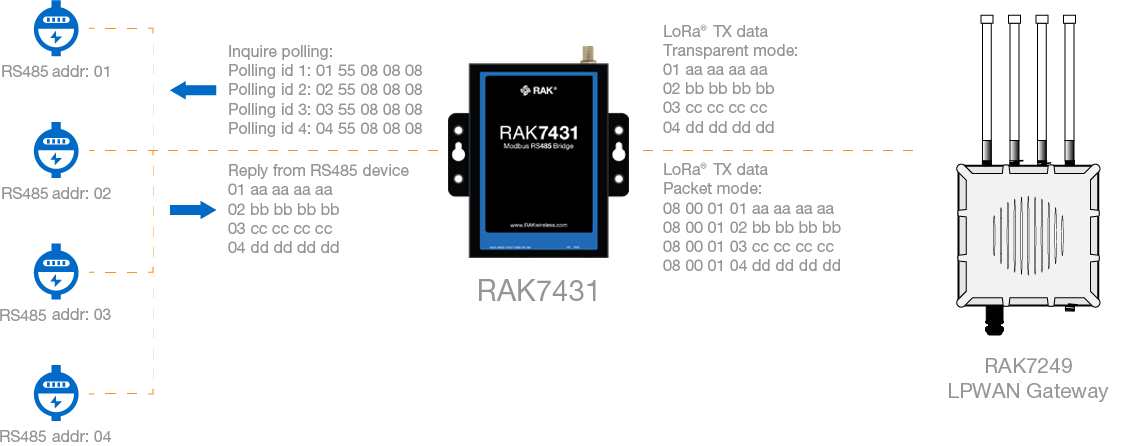 Figure 1: Scheduled polling example
Scheduled Polling Cycle
This command sets/reads the scheduled polling cycle. This command only works if scheduled polling is enabled. The modification takes effect after the next polling cycle or a restart.
Example: To set the polling cycle to 60 seconds, use this command:
AT+POLLPERIOD=60
RAK7431 supports polling mode, which stores up to 32 query instructions at a maximum length of 128 bytes per instruction. Polling intervals and wait times can be adjusted as needed. RAK7431 converts the data returned by the RS485 node into a LoRaWAN message, which can be sent to the LoRaWAN gateway as is or encapsulated. In transparent mode, the data for the RS485 is sent in the payload of the LoRa message as is, and in non-transparent mode, the data of RS485 is encapsulated in the LoRa message with a header and validation.
Add Polling Instructions
To add polling instruction, execute the AT command:
AT+ADDPOLL=<n>:<xxxx>
| Parameter | Description | Value Range |
|---|---|---|
| n | polling instruction ID | 1 to 127 |
| xxxx | polling instruction content; hexadecimal string | 128 bytes max |
According to the temperature and humidity register address of the temperature and humidity sensor in the example and the RS485 address, the polling instruction should be:
AT+ADDPOLL=1:010300000002C40B
Example: If you have added multiple RS485 temperature and humidity sensors, continue to increase the polling instructions based on the RS485 address and register address, for example:
- RS485 Temperature and humidity sensor addr: 01, Polling 1: 010300000002C40B
- RS485 Temperature and humidity sensor addr: 04, Polling 2: 040300000002C45E
- RS485 Temperature and humidity sensor addr: 08, Polling 3: 080300000002C492
- RS485 Temperature and humidity sensor addr: 0F, Polling 4: 0F0300000002C525
You will need to increase the polling instruction by the following AT commands:
AT+ADDPOLL=1:010300000002C40B
AT+ADDPOLL=2:040300000002C45E
AT+ADDPOLL=3:080300000002C492
AT+ADDPOLL=4:0F0300000002C525
The RAK7431 sends an instruction to the sensor every 1 minute to obtain temperature and humidity data, and the following is the result of 3 consecutive scheduled polls:
- DTU Tx: The polling instruction sent to the Sensors over RS485 Data Interface
- DTU Rx: The sensor data received.
- LoRa Tx:Send the received data through a LoRaWAN network.
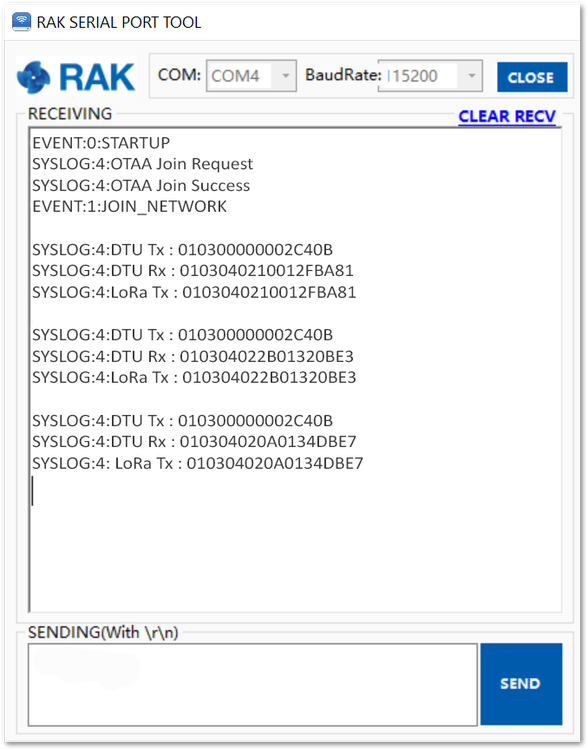 Figure 1: Data in transparent mode
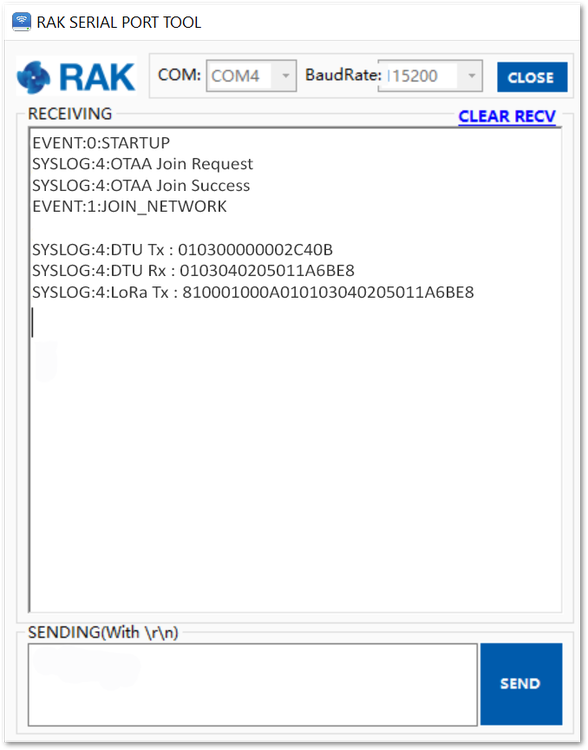 Figure 1: Data in non-transparent mode
- Humidity calculation: hex is 0210, the decimal is 528, converted humidity is 52.8% RH.
- Temperature calculation: hex is 012F, the decimal is 303, converted temperature is 30.3° C.
MQTT Subscribe to Data Server
To better demonstrate the functionality, you will use the gateway MQTT integration feature to subscribe to the Built-In Network Server Topics, using the MQTT client, to obtain data and send instructions to the RAK7431. To communicate with the MQTT bridge in the gateway, you need to use MQTT Topic Templates.
MQTT Topic Configuration:
Application/{{application_ID}}/device/{{device_EUI}}/join
Application/{{application_ID}}/device/{{device_EUI}}/rx
Application/{{application_ID}}/device/{{device_EUI}}/tx
Application/{{application_ID}}/device/{{device_EUI}}/ack
Application/{{application_ID}}/device/{{device_EUI}}/status
-
Download and install MQTTfx tool to read the topics and send data to the gateway and node.
-
After installation, the MQTT Client must be configured. Select local mosquitto from the drop-down list and click the edit connection profiles icon marked in the image below to open the settings page.
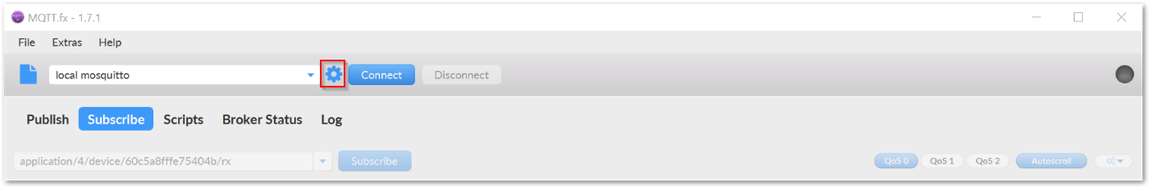 Figure 1: MQTT.fx Client
- On the next window, input the Broker Address and Broker Port. If the Client ID is empty press Generate. Then click OK.
- Broker Address: Address of MQTT server – the gateway IP.
- Broker Port: Consistent with MQTT Broker Port set by the gateway - by default 1883.
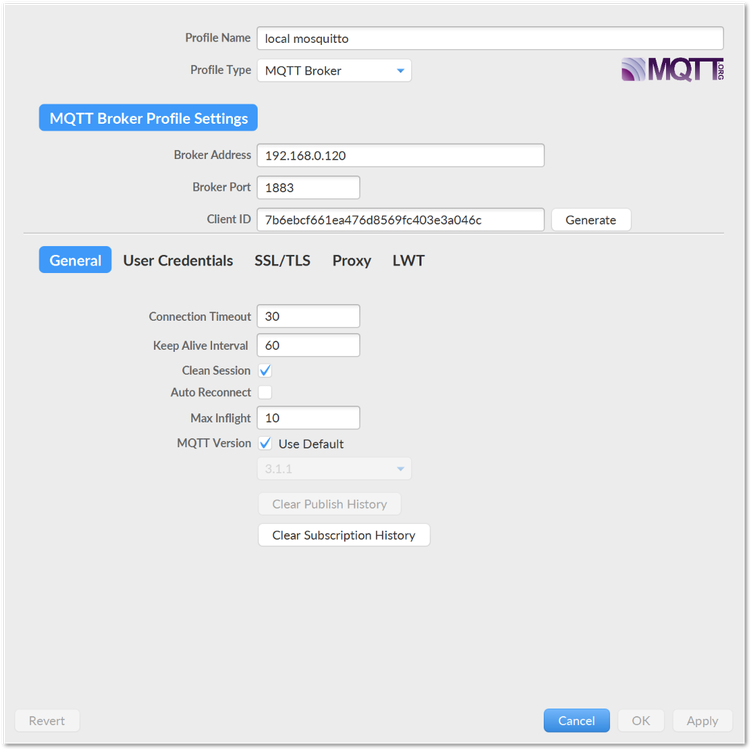 Figure 1: MQTT.fx settings
- Click on the Connect button. The green dot indicates that the connection is successfully subscribed to the MQTT Broker.
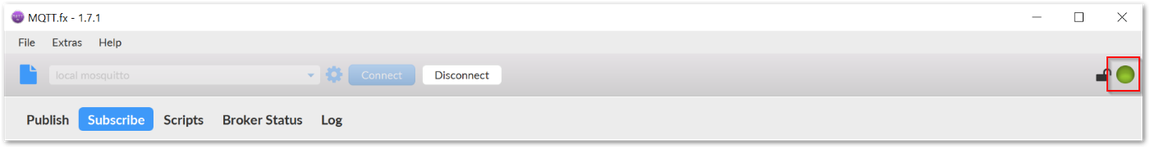 Figure 1: MQTT.fx connected successfully
- If you want to receive all data from the MQTT Bridge, use the wildcard character #.
- Choose the Subscribe tab, enter the wildcard and press Subscribe.
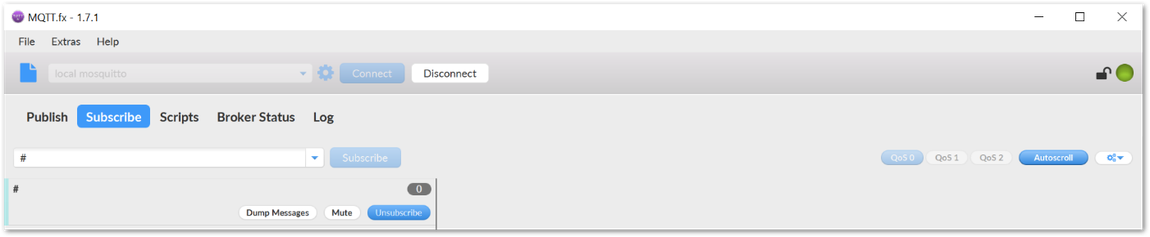 Figure 1: Subscribing to MQTT Broker with wildcard
- If the node sends data, the MQTT client will display it as it is subscribed to the topic.
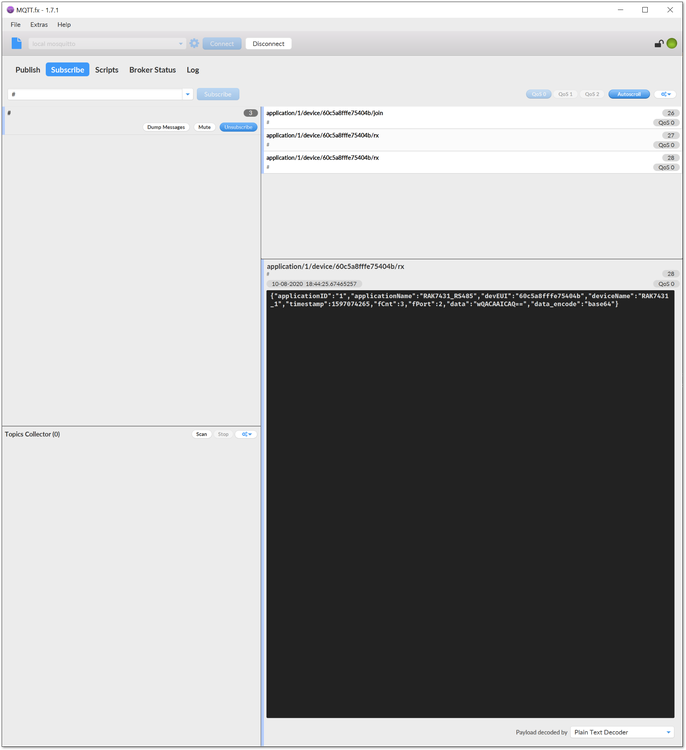 Figure 1: Subscribed topic
- Notice that the data field is in base64 format, which has to be converted to hex string to be useful. You can change the data format from the built-in server settings.
- This is done by going to LoRa>Application, select the application you created and enter the "Configuration" interface of the application. Chose HEX String in Decode Type . Press Save changes.
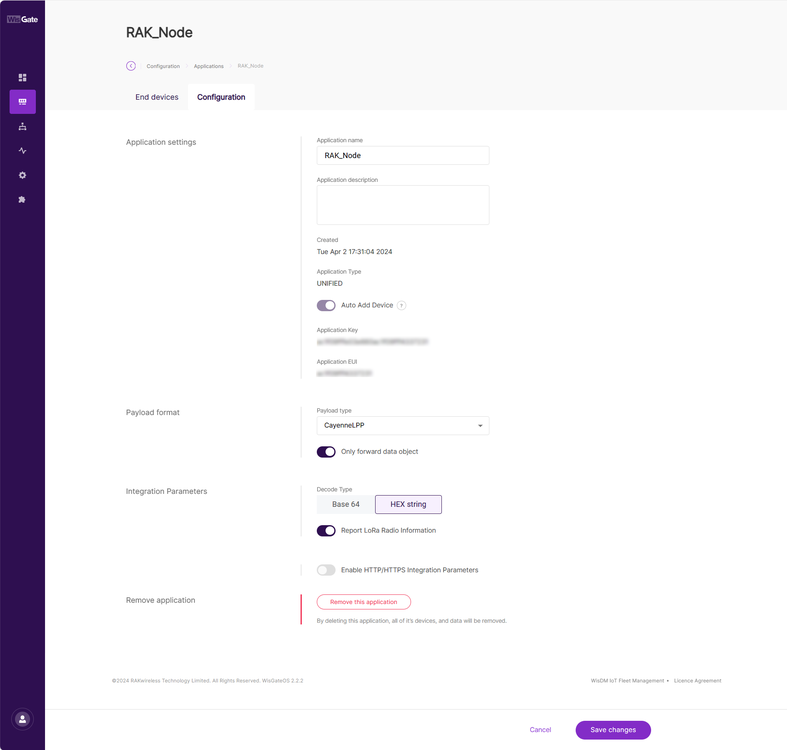 Figure 1: Change the Data Encode/Decode Type
RAK7431 Remote Control and Configuration via MQTT.fx
To remotely control the RAK7431 you need to publish messages to the Gateway’s Network Server MQTT “TX” topic.
Add a Scheduled Polling Task List
Downlink instruction message format:
| DTU_CMD | MSER | MDATA_LEN | MDATA | |
|---|---|---|---|---|
| 0x03 | 2Byte | 2Byte | TASK_ID | DATA |
| 1Byte | nByte | |||
The message length does not contain the header.
Example: You will add a polling instruction.
Publish topic:
application/1/device/60c5a8fffe75404b/tx
Application ID and Device EUI should be consistent with the settings within the gateway.
- To successfully complete this, the JSON data format must be followed.
Content of the uplink:
{
"confirmed":true,
"fPort":129,
"data":"030001000901010300000002C40B"
}
| Parameter | Description |
|---|---|
| "confirmed":true | This indicates that the downlink to the RAK7431 will be confirmed for successful receiving. |
| "fPort":129 | Defines the port that you want to send the command. (For more information on the fPort see the AT Command Manual for RAK7431) |
| "data":"030001000901010300000002C40B" | The data of the task in hexadecimal format. |
The content of the data that you will send is:
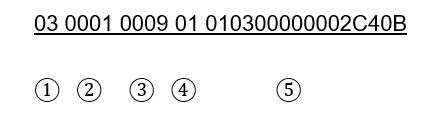 Figure 1: Data arrangement
- DTU command word
- The message number
- Message length (excluding header)
- The task ID
- The content of the task
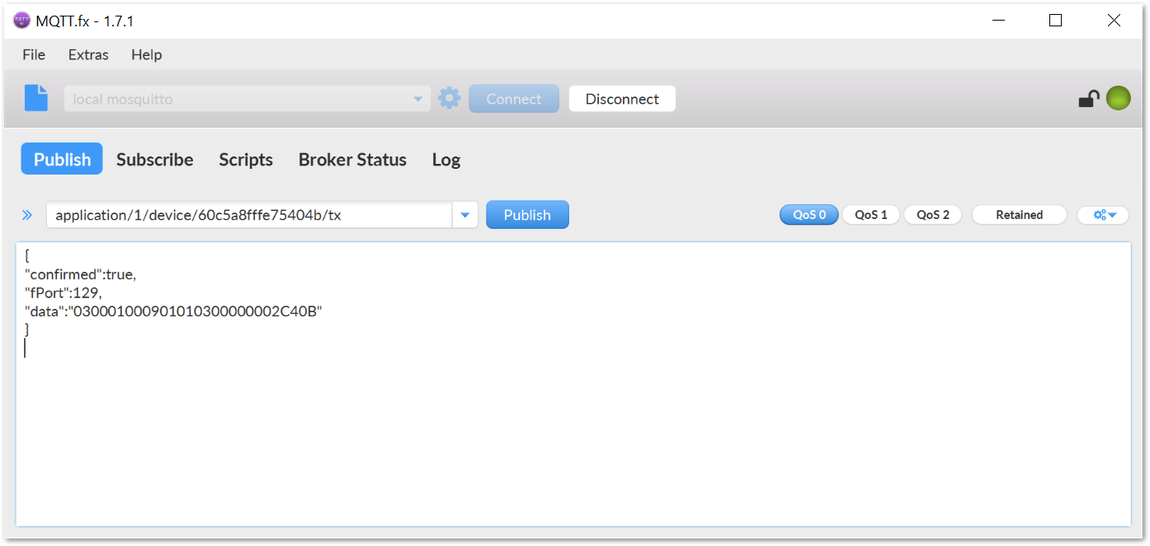 Figure 1: Publishing data to RX topic
- After publishing the data, you can see the downlink instruction and uplink answer from the RAK Serial Tool:
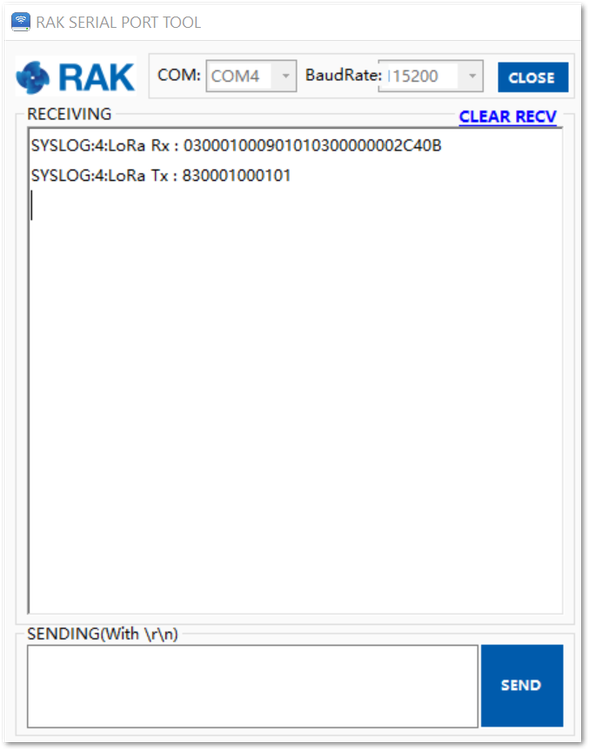 Figure 1: Received data and sent an answer
Message format when execution is successful:
| DTU_CMD | MSER | MDATA_LEN | MDATA |
|---|---|---|---|
| 0x83 | 2Byte | 2Byte | TASK_ID |
| 1Byte |
- The MQTT subscription bar can see the upstream message "83000100010101" for successful execution.
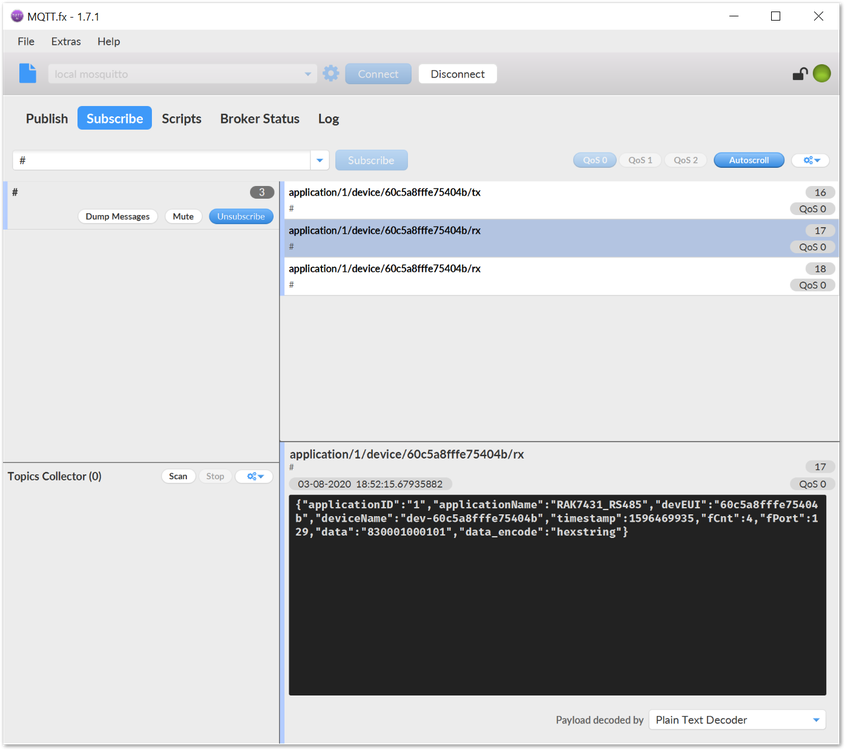 Figure 1: Received confirmation of the task
Remove the Scheduled Polling Task List
Downlink instruction message format:
| DTU_CMD | MSER | MDATA_LEN | MDATA |
|---|---|---|---|
| 0x04 | 2Byte | 2Byte | TASK_ID |
| 1Byte |
Example: Removal of timed polling temperature and humidity sensor task order on a node:
Publish the topic:
Application/1/device/60c5a8fffe75404b/tx
Content:
{
"confirmed":true,
 "fPort":129,
"data":"040001000101"
}
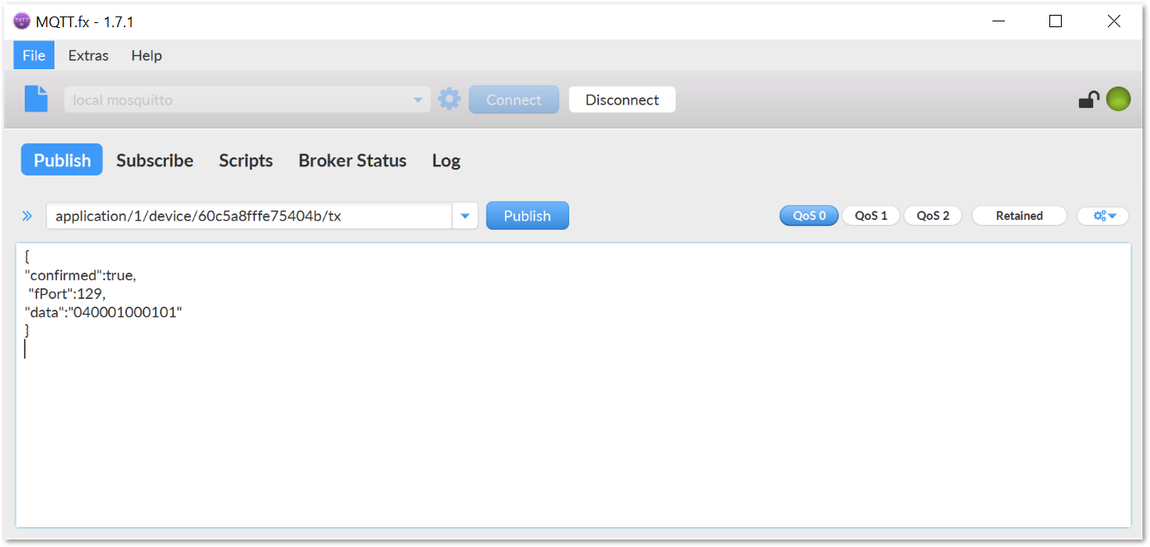 Figure 1: Remove poll downlink message
Message format when execution is successful:
| DTU_CMD | MSER | MDATA_LEN | MDATA |
|---|---|---|---|
| 0x84 | 2Byte | 2Byte | TASK_ID |
| 1Byte |
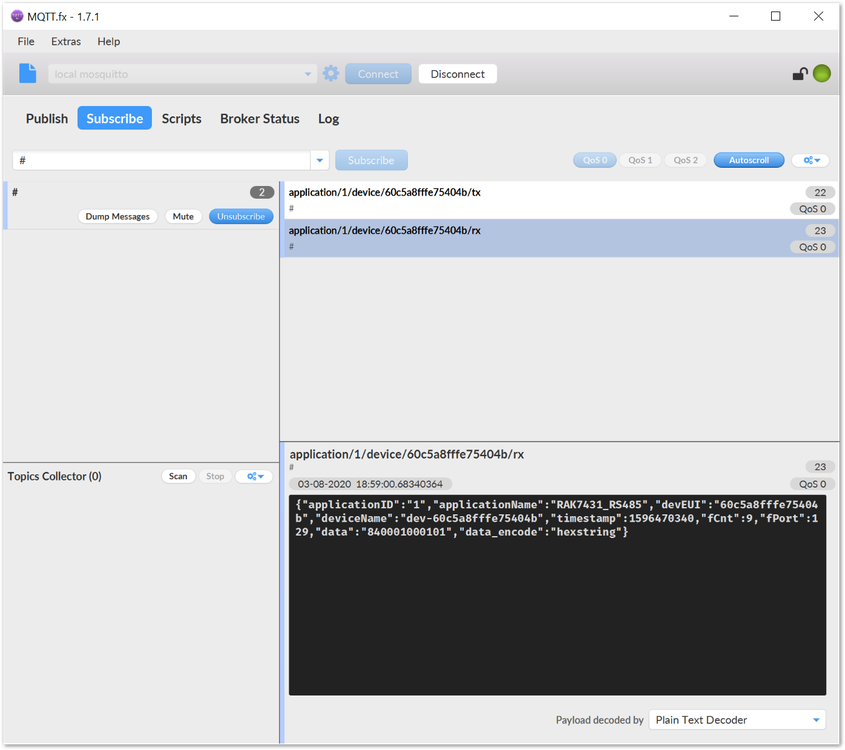 Figure 1: Poll removed successfully message
- The MQTT subscription bar sees the upstream message "84000100010101", which means the task was successfully removed.
Read the Scheduled Polling Task List
Downlink instruction message format:
| DTU_CMD | MSER | MDATA_LEN | MDATA |
|---|---|---|---|
| 0x05 | 2Byte | 2Byte | TASK_ID |
| 1Byte |
Publish topic:
application/1/device/60c5a8fffe75404b/tx
Content:
{
"confirmed":true,
"fPort":129,
"data":"050001000101"
}
 Figure 1: Publishing the read poll task message
Perform successful upstream message format:
| DTU_CMD | MSER | MDATA_LEN | MDATA | |
|---|---|---|---|---|
| 0x85 | 2Byte | 2Byte | TASK_ID | DATA |
| 1Byte | nByte | |||
- Open the MQTT subscription column that is to see to the performance of the above line: "8500010009010103000000002C40B" is the query to the task, the order ID is 1, the task order content is 010300000002C40B (example registers).
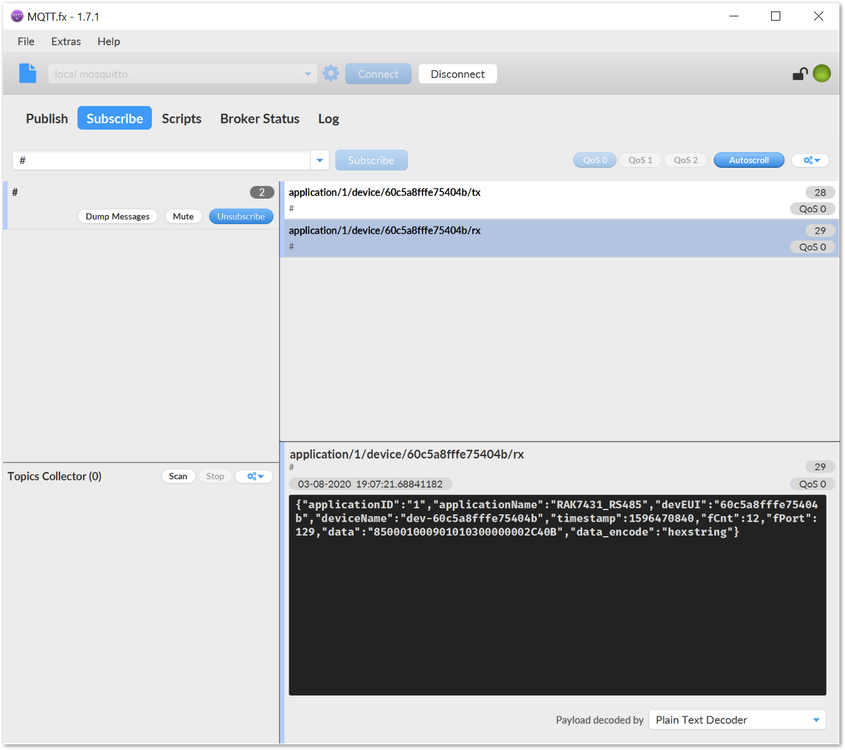 Figure 1: Received message from the node
Read the LoRa Configuration��
Downlink instruction message format:
| DTU_CMD | MSER | MDATA_LEN | MDATA |
|---|---|---|---|
| 0x06 | 2Byte | 2Byte | 0Byte |
Publish topic:
Application/1/device/60c5a8fffe75404b/tx
Content:
{
"confirmed":true,
"fPort":129,
 "data":"0600010000"
}
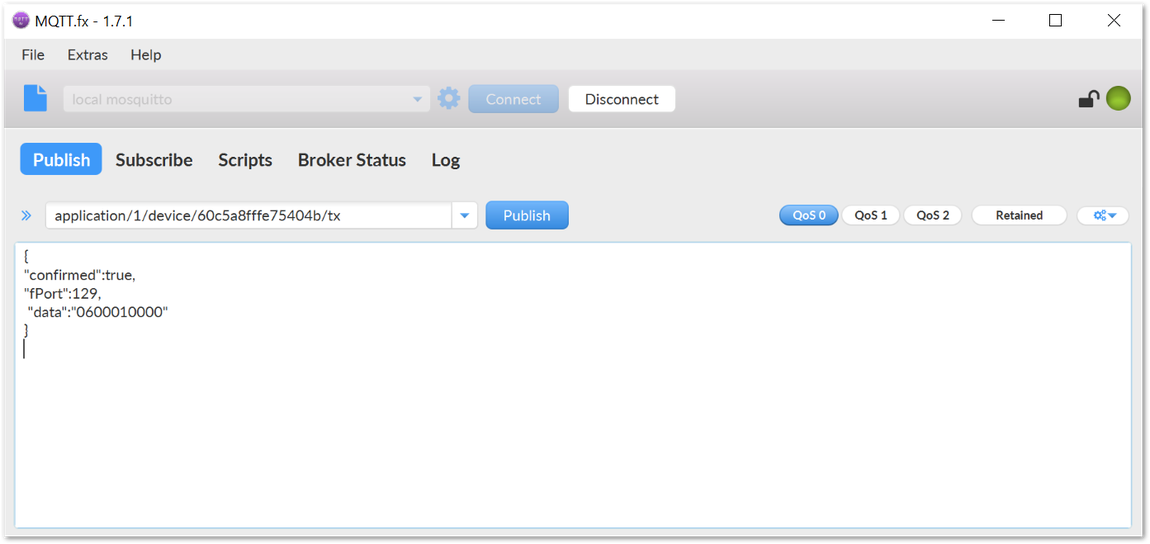 Figure 1: Publish LoRa configuration read message
Perform successful upstream message format:
| DTU_CMD | MSER | MDATA_LEN | MDATA | |||||
|---|---|---|---|---|---|---|---|---|
| 0x86 | 2Byte | 2Byte | DATA RATE | TXPWR | CONFIRM | RETRY | ADR | DUTY CYCLE |
| 1Byte | 1Byte | 1Byte | 1Byte | 1Byte | 1Byte | |||
- DATARATE: Speed rate (0 – 5)
- TXPOWER: The transmit power level (0 – 20)
- CONFIRM: Whether to turn on ACK 0 – off, 1 – on
- RETRY: Maximum re-transmission times when ACK is on (0 ~ 15)
- ADR: Whether to turn on the dynamic rate adjustment 0 – off, 1 - on
- DUTY CYCLE: Whether to turn on duty cycle limit 0 – off, 1 – on
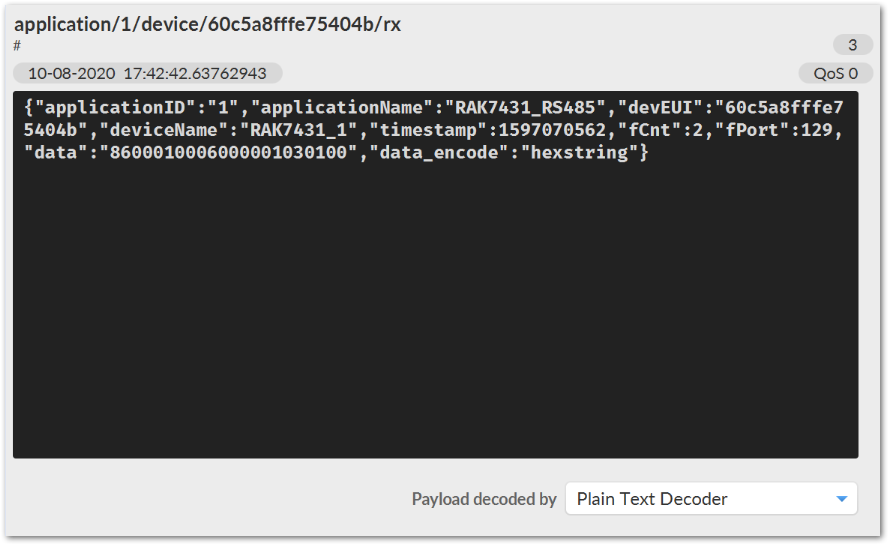 Figure 1: Received message with LoRa configuration
- Open the MQTT subscription bar to see the upstream message "860001000006000010301000000" to read the LoRa configuration based on the upstream message format for the successful execution above.
Change the LoRa Configuration
Downlink instruction message format:
| DTU_CMD | MSER | MDATA_LEN | MDATA | |||||
|---|---|---|---|---|---|---|---|---|
| 0x07 | 2Byte | 2Byte | DATA RATE | TXPWR | CONFIRM | RETRY | ADR | DUTY CYCLE |
| 1Byte | 1Byte | 1Byte | 1Byte | 1Byte | 1Byte | |||
Publish topic:
Application/1/device/60c5a8fffe75404b/tx
Content:
{
"confirmed":true,
"fPort":129,
"data":"070001000601050103010"
}
- The above command changes the data rate to "1" and the transmit power to "5".
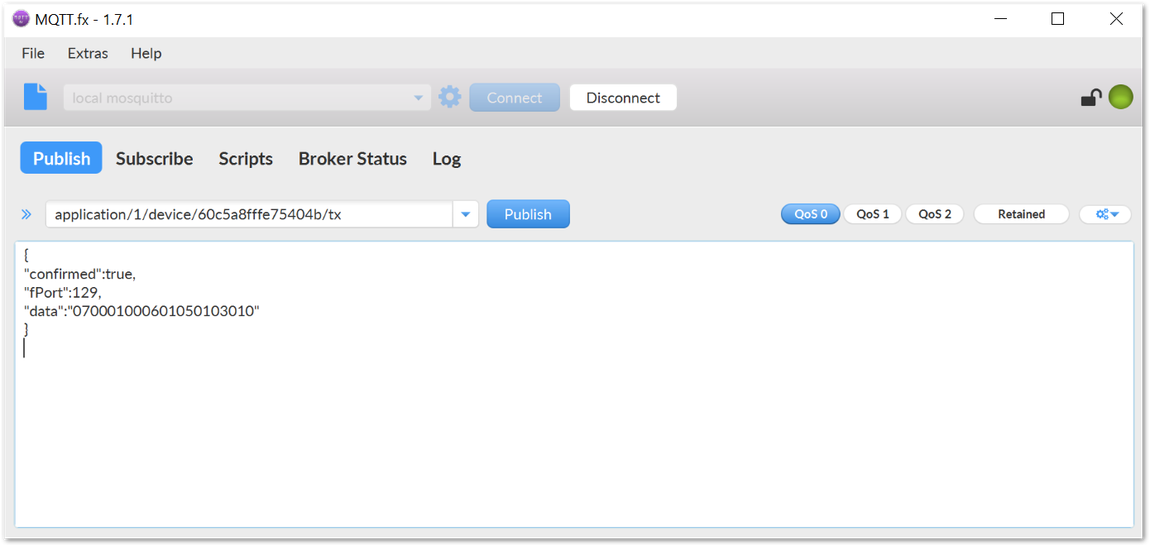 Figure 1: Publish change LoRa configuration data
Perform successful upstream message format:
| DTU_CMD | MSER | MDATA_LEN | MDATA |
|---|---|---|---|
| 0x87 | 2Byte | 2Byte | 0Byte |
- Open the MQTT subscription bar to see the upstream message for successful execution: "8700010000".
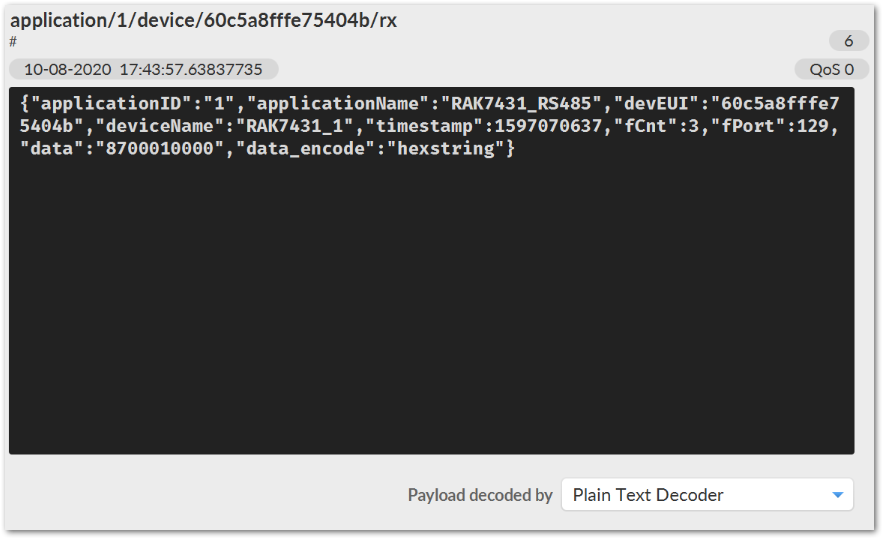 Figure 1: Received confirmation message
Reset the Default LoRa Configuration
Publish topic:
Application/1/device/60c5a8fffe75404b/tx
Content:
{
"confirmed":true,
"fPort":129,
"data":"1D00010000"
}
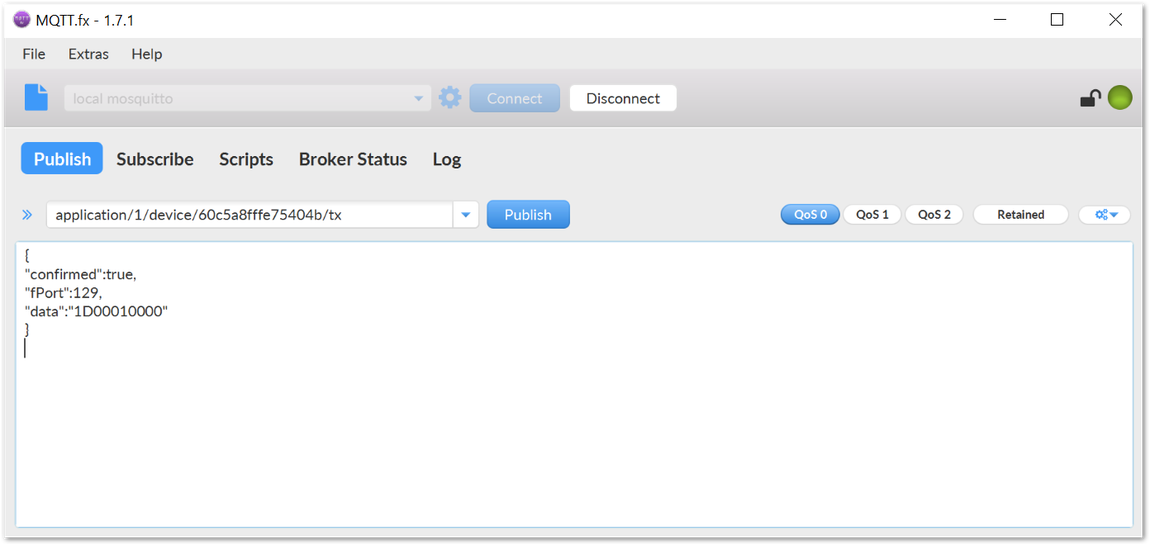 Figure 1: Publish reset the default LoRa configuration
- Open the MQTT subscription bar to see the upstream message for successful execution: "9D00010000".
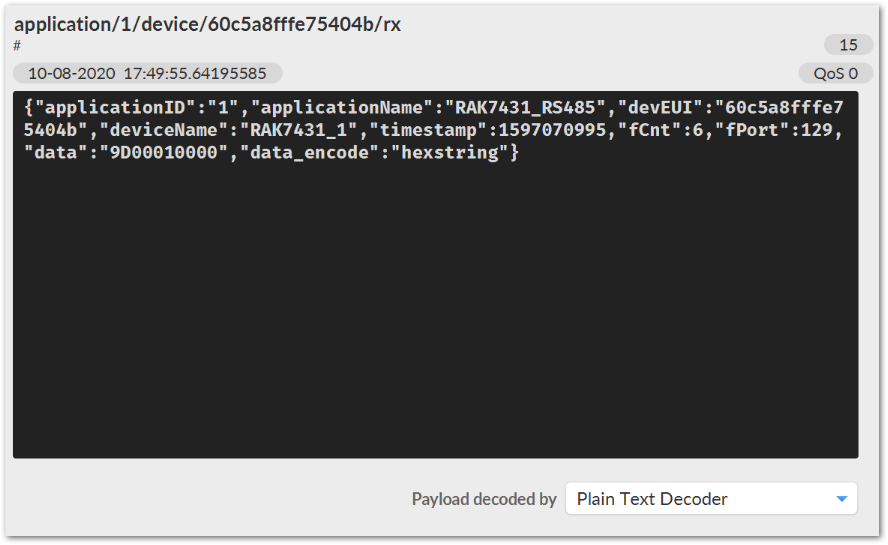 Figure 1: Received Data
LORA configuration default values:
| DATARATE | TXPOWER | CONFIRM | RETRY | ADR_ENABlE | DUTYCYCLE_ENABLE |
|---|---|---|---|---|---|
| 0 – DR_0 | 19 -19dBm | 1 – open | 3 times | 1 – open | 0 – close |
Read the DTU Configuration
Downlink instruction message format:
| DTU_CMD | MSER | MDATA_LEN | MDATA |
|---|---|---|---|
| 0x08 | 2Byte | 2Byte | 0Byte |
Publish topic:
Application/1/device/60c5a8fffe75404b/tx
Content:
{
"confirmed":true,
"fPort":129,
"data":"0800010000"
}
 Figure 1: Publish message for reading the DTU configuration
Uplink data message format when execution successful:
| DTU_CMD | MSER | MDATA_LEN | MDATA | ||||
|---|---|---|---|---|---|---|---|
| 0x88 | 2Byte | 2Byte | POLL ENABLE | POLL PERIOD | BUS TIMEOUT | RETRY | RS485 |
| 1Byte | 4Byte | 1Byte | 1Byte | 1Byte | |||
- POLL ENABLE: Enables scheduled polling, 0 - off, 1 - on
- POLL PERIOD: Polling period, in seconds
- BUS TIMEOUT: Bus timeout. The unit is seconds
- RETRY: Number of retries after bus timeout. 0 - turn off retry function
- RS485: 485 bus parameters
Open the MQTT subscription bar to see the upstream message "8800010000800000003C010050" to read the DTU configuration according to the successful upstream message format above.
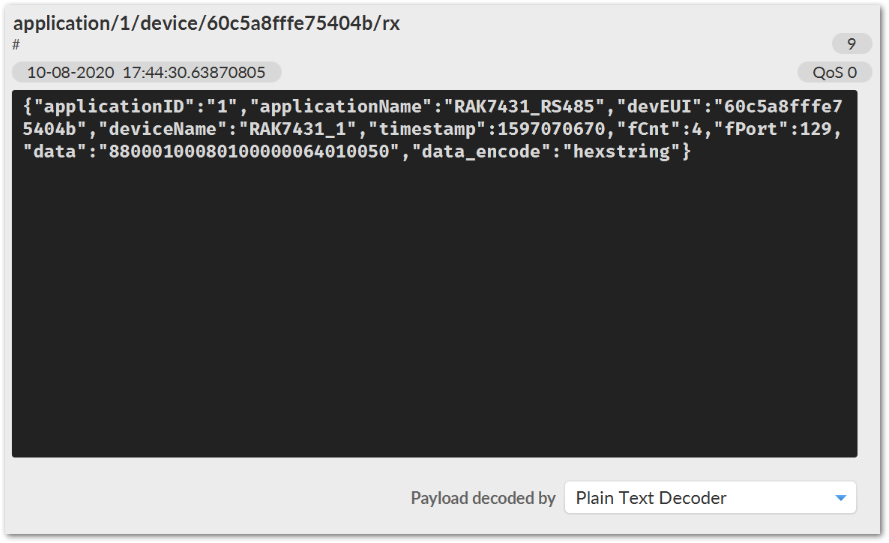 Figure 1: Received message with current DTU configuration
Change the DTU POLL Configuration
Downlink instruction message format:
| DTU_CMD | MSER | MDATA_LEN | MDATA | ||||
|---|---|---|---|---|---|---|---|
| 0x09 | 2Byte | 2Byte | POLL ENABLE | POLL PERIOD | BUS TIMEOUT | RETRY | RS485 |
| 1Byte | 4Byte | 1Byte | 1Byte | 1Byte | |||
Publish topic:
Application/1/device/60c5a8fffe75404b/tx
Content:
{
"confirmed":true,
"fPort":129,
"data":"09000100080100000E10010050"
}
- The above command changes the polling period to only 1 hour.
 Figure 1: Publish message for change the DTU configuration
Uplink data message format when execution successful:
| DTU_CMD | MSER | MDATA_LEN | MDATA |
|---|---|---|---|
| 0x89 | 2Byte | 2Byte | 0Byte |
- Open the MQTT subscription bar to see the upstream message for successful execution: "8900010000".
 Figure 1: Received confirmation message
Reset the Default DTU Configuration
Publish topic:
Application/1/device/60c5a8fffe75404b/tx
Content:
{
"confirmed":true,
"fPort":129,
"data":"1E00010000"
}
 Figure 1: Publish reset the default DTU configuration
- Open the MQTT subscription bar to see the upstream message for successful execution: "9E00010000".
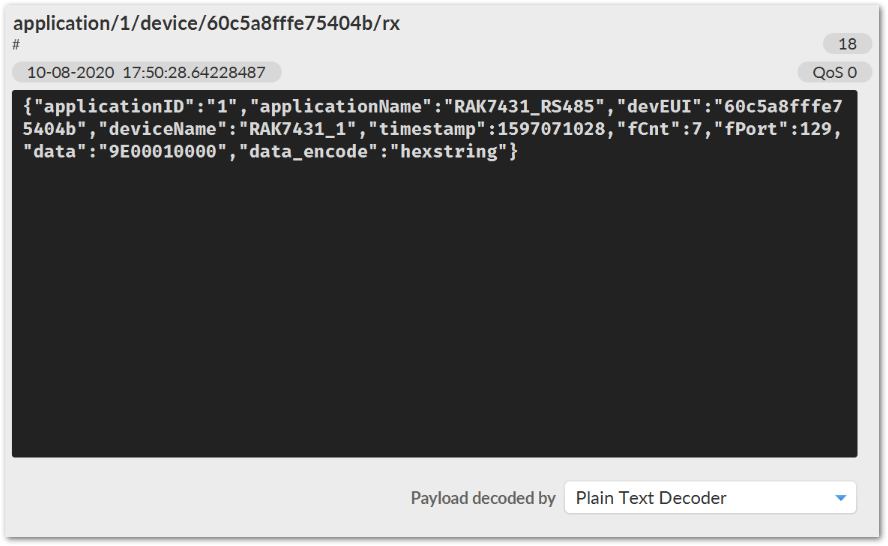 Figure 1: Received Data
DTU Configure the initial value:
| POLL_ENABLE | POLL_PERIOD | BUS_TIMEOUT | RS485 |
|---|---|---|---|
| 1 - on | 3600 seconds | 1 second | 0xE0 |
Connecting to the Helium Network
Helium has quickly become the most widespread LPWAN communal network with more than 27,000 devices deployed globally. All the RAKwireless node products are compatible with it and the process of adding a device to the network is intuitive and straightforward.
This section will focus on giving a brief guide on how to connect the RAK7431 to the network console, assuming that there is a Helium Hotspot within range.
Log in or create your account in the Helium console page.
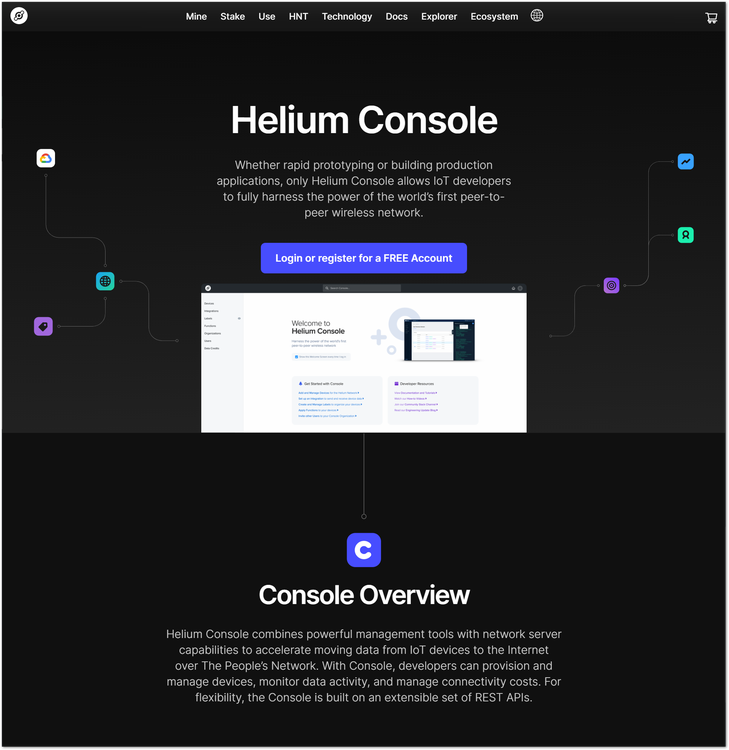 Figure 1: Helium Console
Once registered/logged in, you will end up at the home page where you can see your function tree on the left and your DC balance at the top, as well as several useful links.
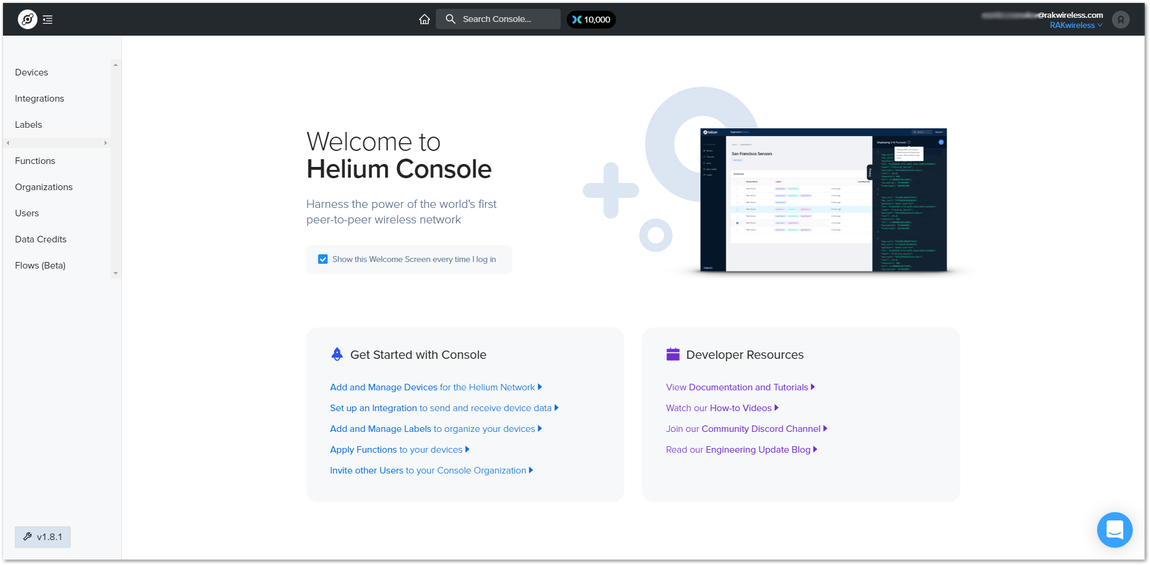 Figure 1: Helium console home screen
Go to the Devices section in the function tree. If this is your first time doing this, there will be no devices registered. Click the + Add Device button to get started.
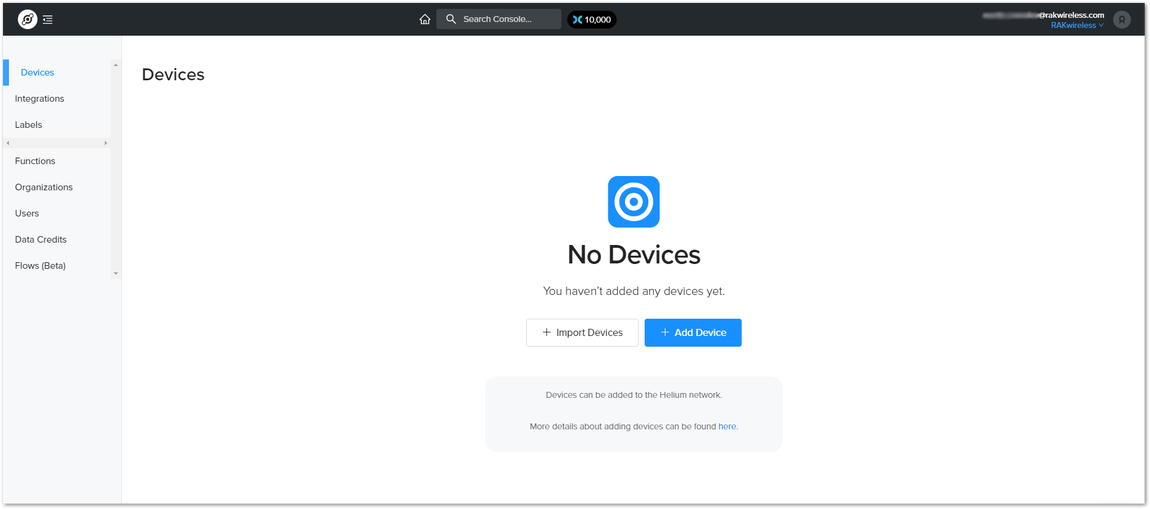 Figure 1: Devices section
A window will pop up with a set of a field containing the device parameters required for its registration.
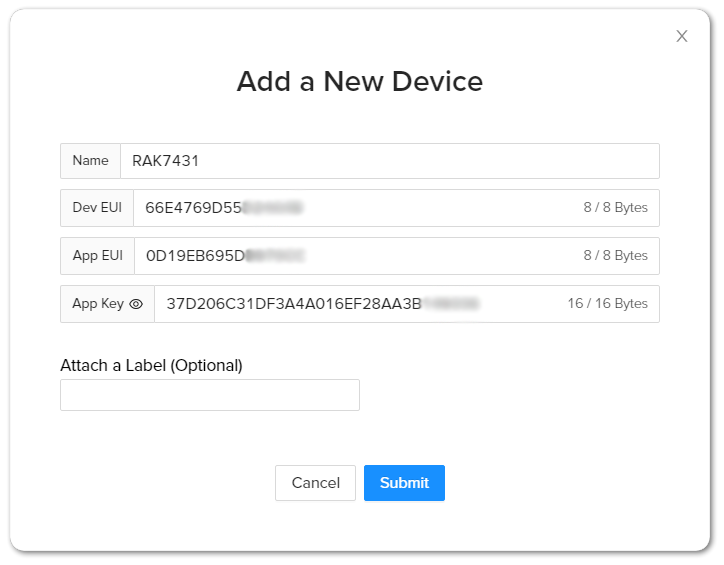 Figure 1: Adding a new device
Fill in a name of your choosing. The Dev EUI, App EUI, and App Key will have random values generated for you by default. Press the eye icon to reveal the values. You can manually replace them with values of your own. For this tutorial, use the default values. Press the Submit button, and you are done.
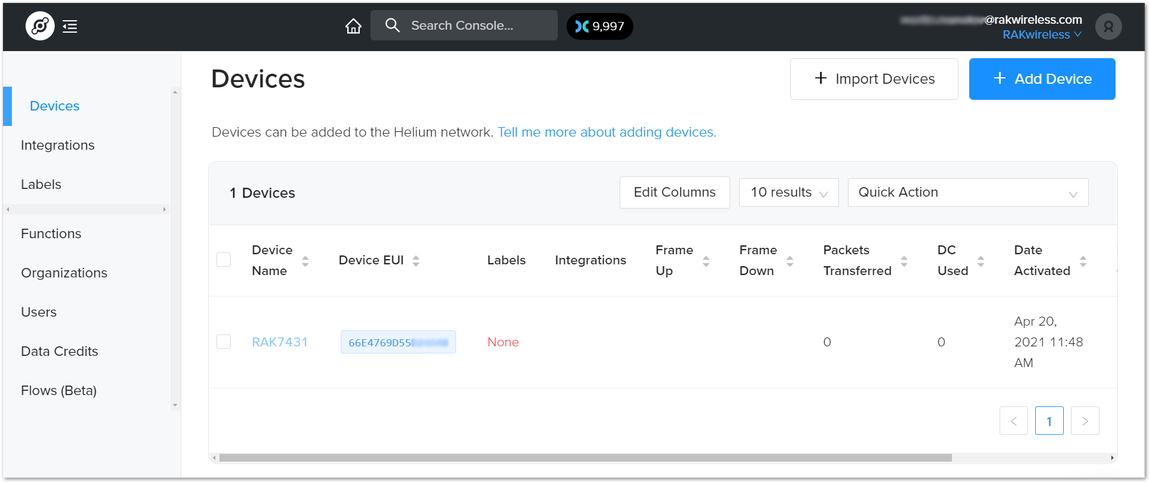 Figure 1: Helium devices
Now, your RAK7431 is registered and is awaiting activation. For this to happen, you need to import the Dev EUI, App EUI, and App Key in the RAK7431 using the RAK Serial Port Tool.
Open the tool, select the desired port (default baud rate) and open it. Then start importing your settings.
Configure your LoRa band and activation mode. This tutorial will be using the EU868 band and OTAA (the only option available for now with Helium) with device class A (default one, does not need configuring).
- Regional band, device class, and activation mode setting
at+joinmode=OTAA
at+region=EU868
- Enter the Dev UI
Use the command below by replacing the XXXX with your Device EUI from the Helium console:
at+deveui=XXXX
- Enter the App EUI
The same as with the Device EUI, replace the XXXX with your value:
at+appeui=XXXX
- Enter App Key
Finally, fill in the App key with the following command:
at+appkey=XXXX
- Join Network
Run the following AT command in order for the node to join the network.
Once the procedure is initiated and successfully complete, you will have a notification in the serial console.
at+restart
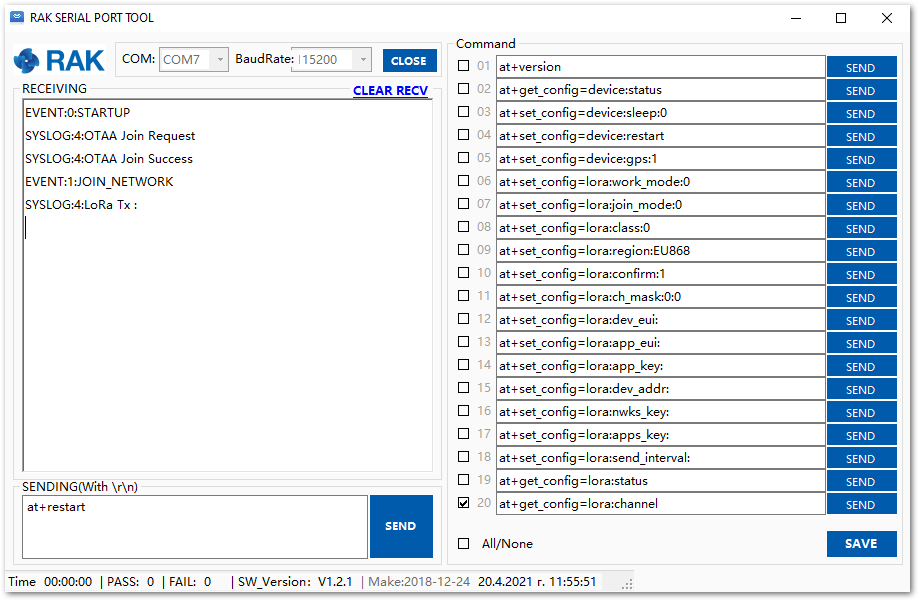 Figure 1: RAK7431 EUIs and key
If you take a look at the Helium console, you will also see the join request packets both in the graph and event log. Your node is now a part of the Helium Network.
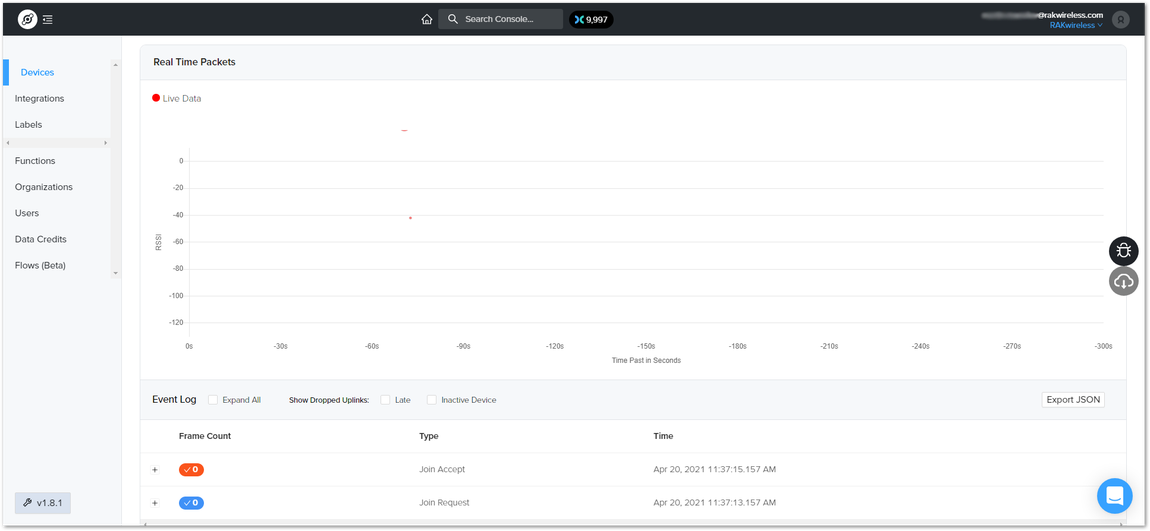 Figure 1: Helium console live device data
Connecting to The Things Network V3 (TTNv3)
At The Things Conference 2021, it was announced that The Things Network is upgrading to The Things Stack v3. In this section, it will be shown how to connect RAK7431 WisNode Bridge Serial to The Things Stack. To login into the TTNv3, head on here. If you already have a TTN account, you can use your The Things ID credentials to log in.
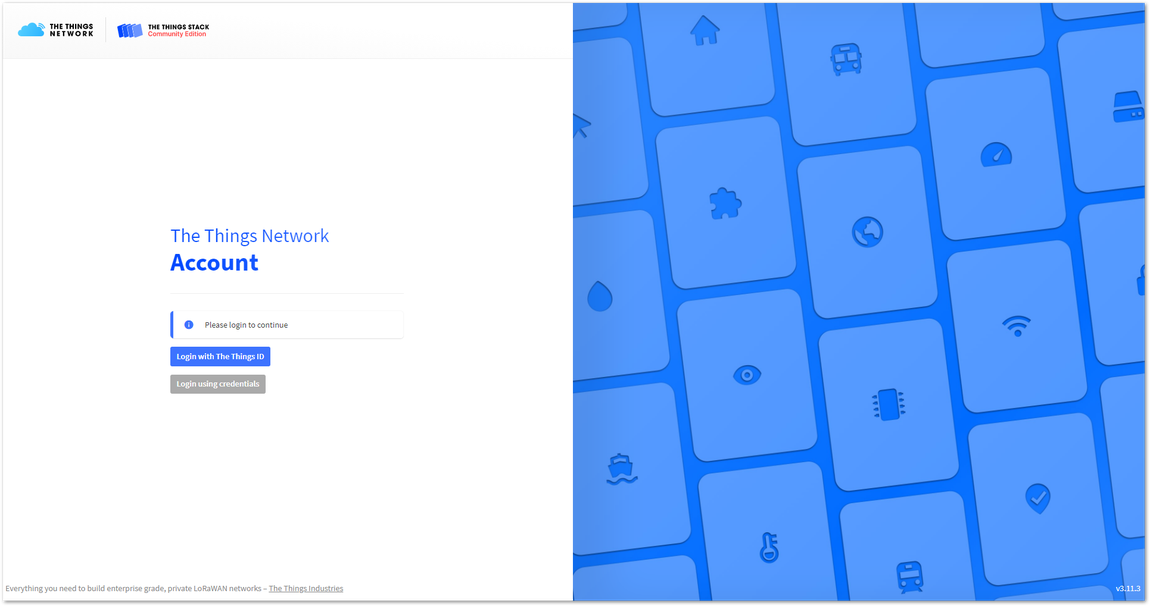 Figure 1: The Things Stack Home Page
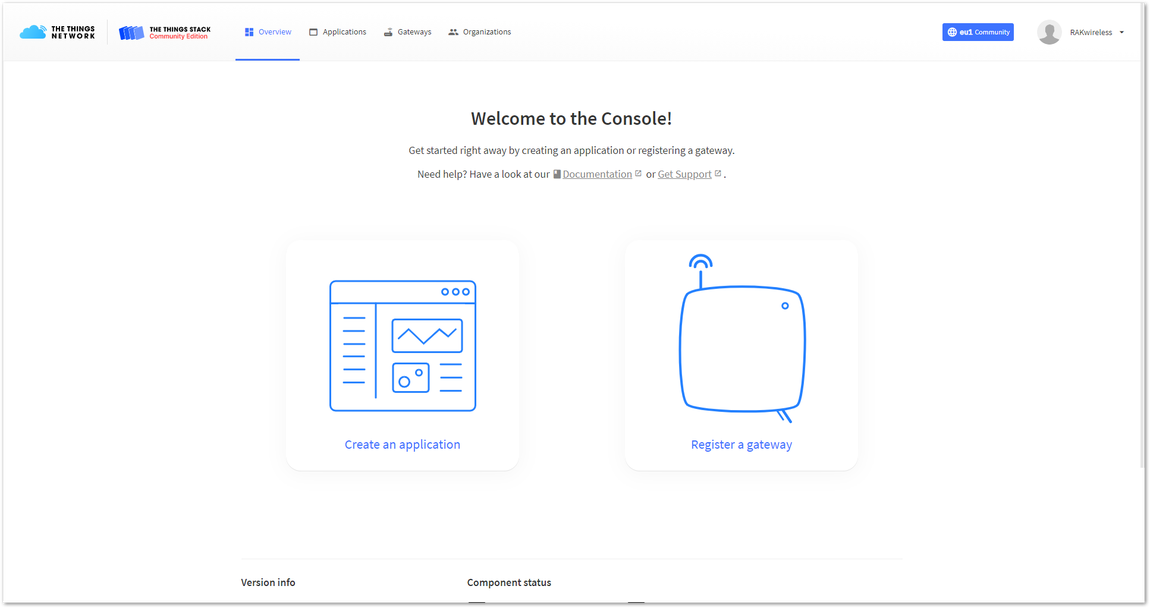 Figure 1: Console Page after successful login
To be able to connect RAK7431 WisNode Bridge Serial to TTNv3 you should already have connected a gateway in range to TTNv2 or TTNv3, or you have to be sure that you are in the range of a public gateway.
Adding an Application
This tutorial is for EU868 Frequency band.
- To create an application, choose Create an application (for new users that do not already have created applications) or Go to applications > + Add application (for users that have created applications before).
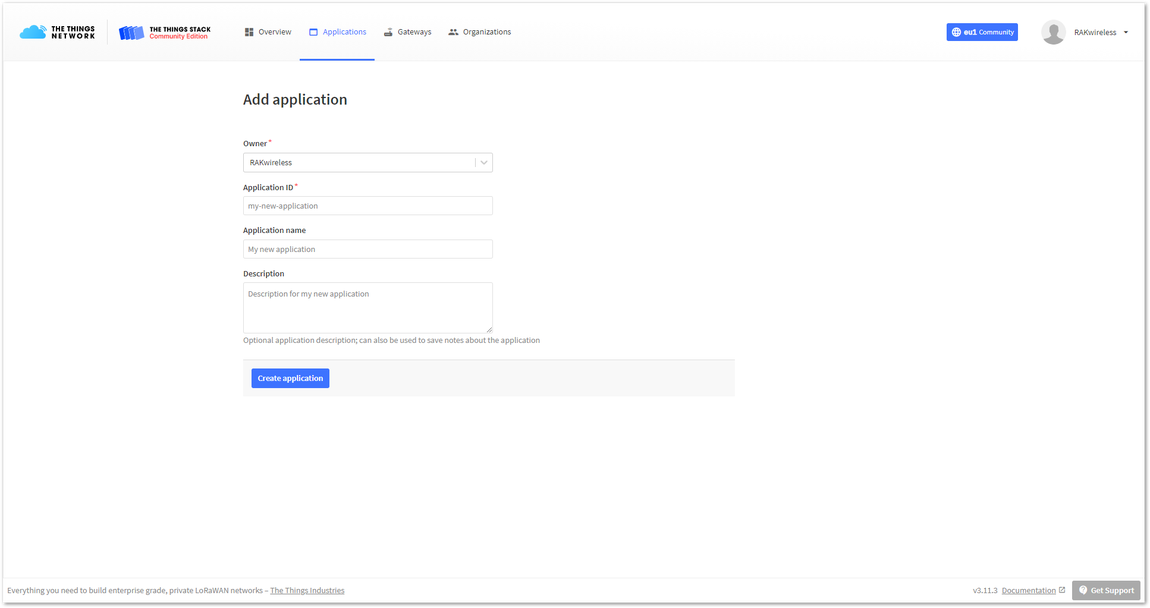 Figure 1: Create an application page
- Fill in the needed information:
- Owner - Automatically filled by The Things Stack, based on your account or created Organization.
- Application ID - This will be the unique ID of your application in the Network. Note that the ID must contain only lowercase letters, numbers, and dashes (-).
- Application name (optional) - This is the name of your application.
- Description (optional) – Description of your application. Optional application description; can also be used to save notes about the application.
- After you fill in the information, click Create application. If everything is filled in correctly, you will see the same page, as shown in Figure 53.
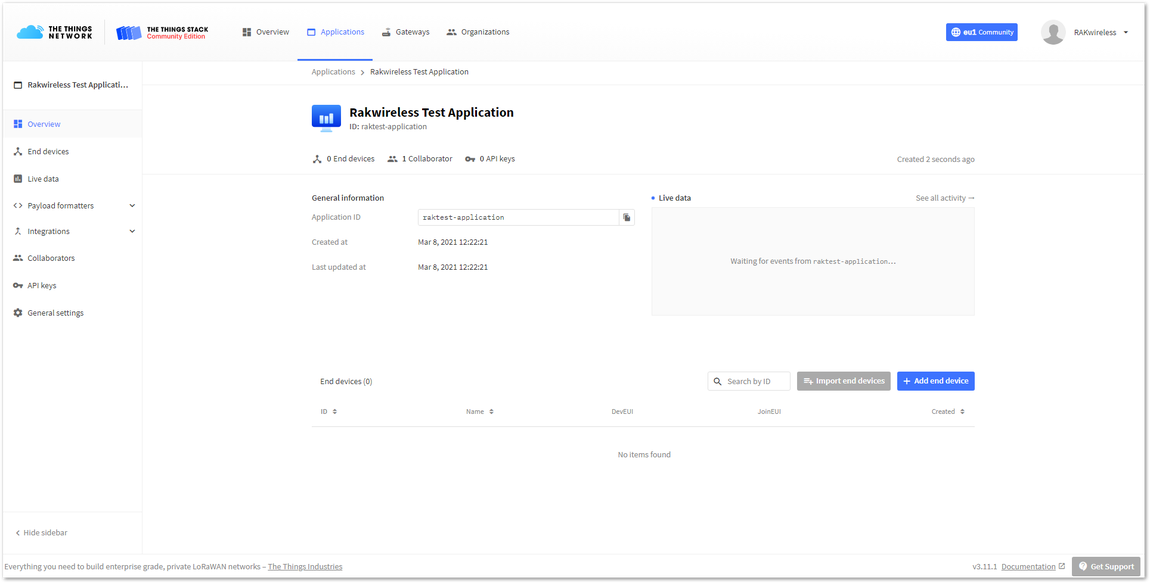 Figure 1: Application Overview
Registering and Configuring the Device In OTAA Mode
Registering the Device in OTAA Mode
- From the Application Overview page, click on + Add end device.
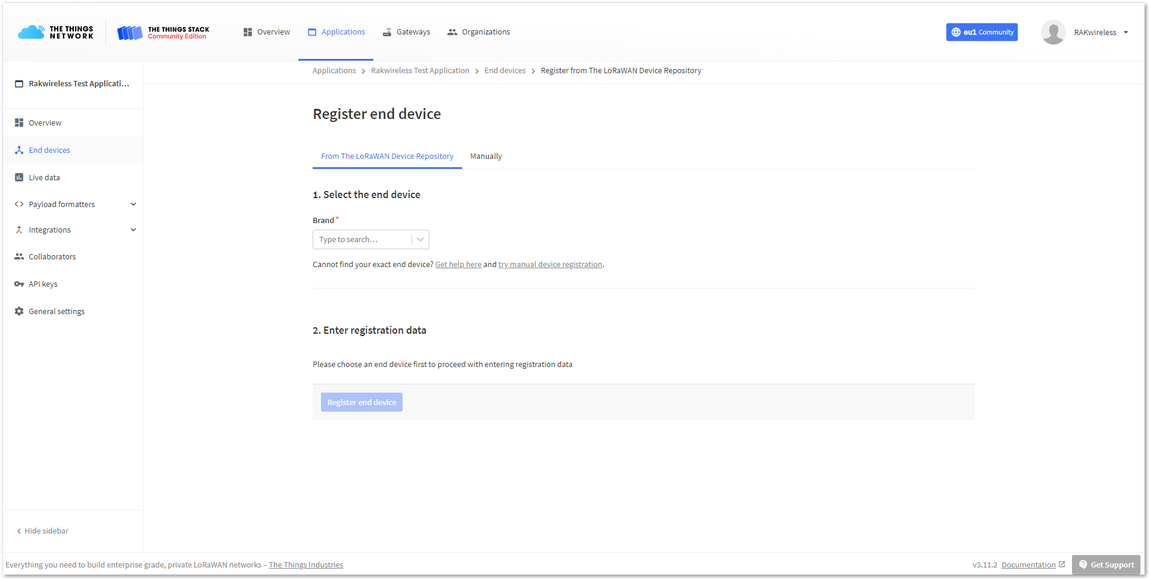 Figure 1: Adding a device in OTAA mode
- Below the Register end device heading you can find two options for registering a device. Since RAK7431 WisNode Bridge Serial is part of The LoRaWAN Device Repository, you can register it From The LoRaWAN Repository option. In the Brand dropdown menu find and select RAKwireless Technology Co. and a Model field will pop up next to it. In it choose RAK7431 WisNode Bridge Serial.
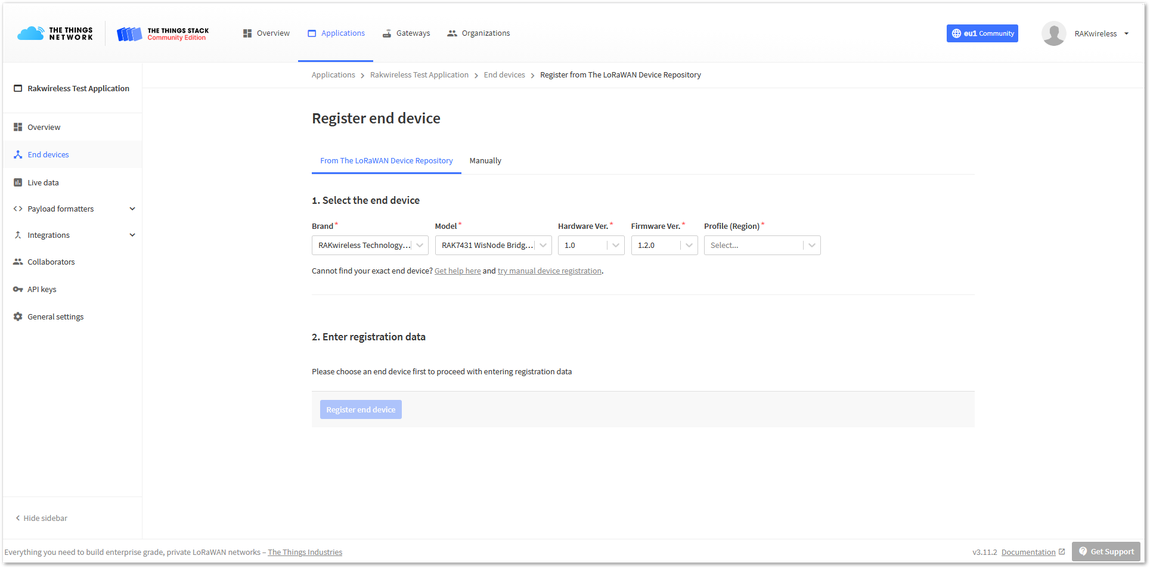 Figure 1: Choosing the device
- After choosing the device, three more fields will pop up.
- Hardware Ver. – Version of the hardware. This is the only option, so leave it as default.
- Firmware Ver. – Version of the firmware. This is the only option, so leave it as default.
- Profile (Region) – Here the region is chosen.
For this example, the EU_863_870 is chosen.
- Next, an Enter registration data heading will pop up below. Scroll down to enter the required data for the device.
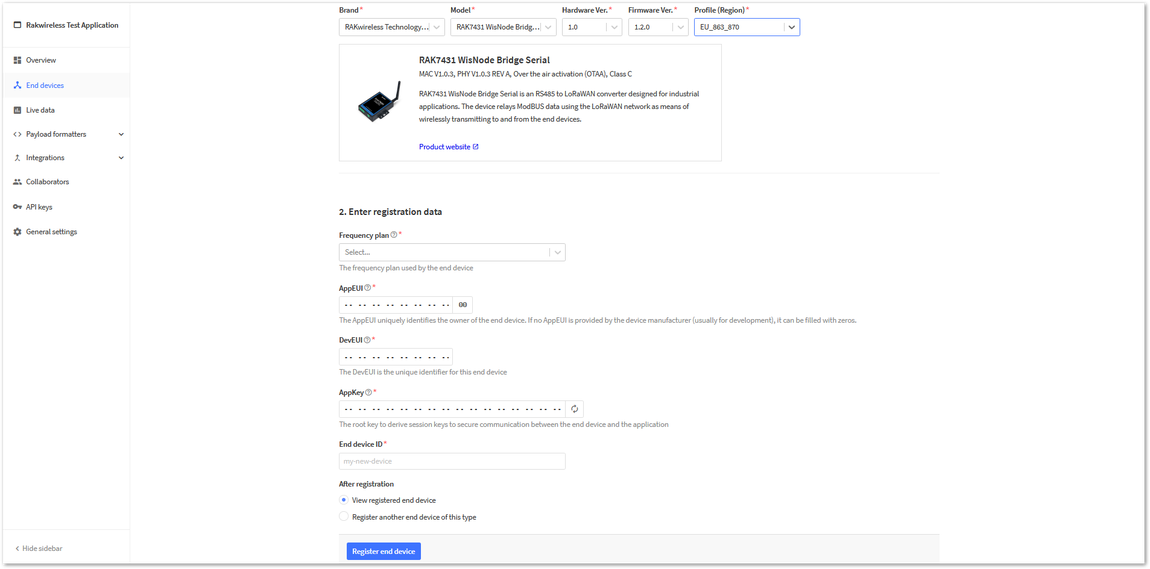 Figure 1: Registration Data
- Here you must enter the following information:
- Frequency plan – Note: For this example, you will choose Europe 863-870 MHz (SF9 for RX2 - recommended).
- AppEUI - The AppEUI uniquely identifies the owner of the end device. It is provided by the device manufacturer. To get the AppEUI, connect your device via USB cable to your computer. Open RAK Serial Port Tool, choose the correct COM port and BaudRate and run the following command:
AT+APPEUI
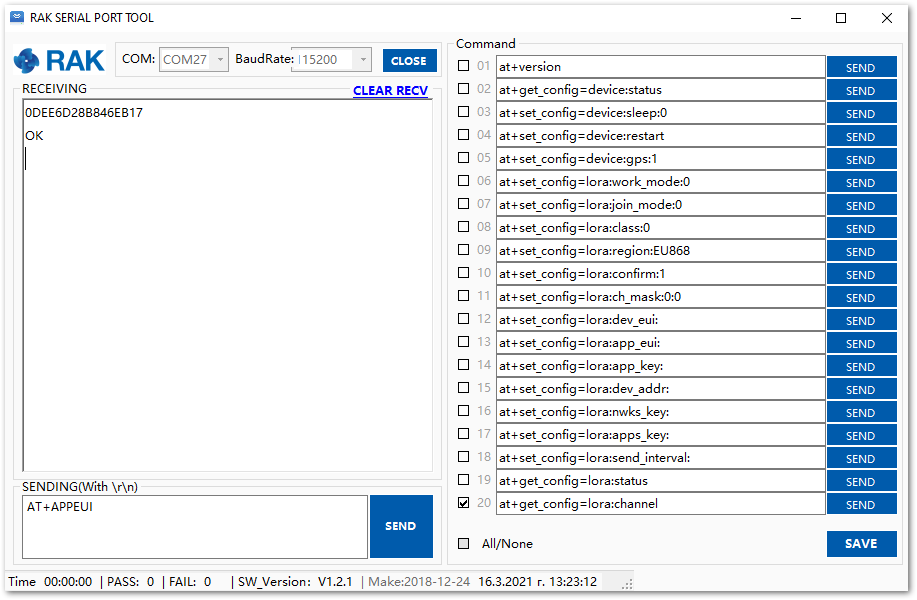 Figure 1: AppEUI of the device
- DevEUI - The DevEUI is the unique identifier for this end device. It is provided by the manufacturer and is printed on the label on the back of the device.
- AppKey - The root key to deriving session keys to secure communication between the end device and the application. AppKey can be generated by clicking the Generate button
 .
. - End device ID – The End device ID is automatically filled based on the DevEUI. It can be changed. Note that the end device ID must contain only lowercase letters, numbers, and dashes (-).
If you are going to register more than one device of this type, you can choose the option Register another end device of this type and be transferred to the same page to register the next device.
- After filling in the registration information, click Register end device.
Configuring the Device in OTAA Mode
- For configuring the node you will need the following three parameters: Device EUI, Application EUI, and Application Key. You can see them all in the Device Overview page, but since the two EUI's come with the device, you only need the Application Key from there.
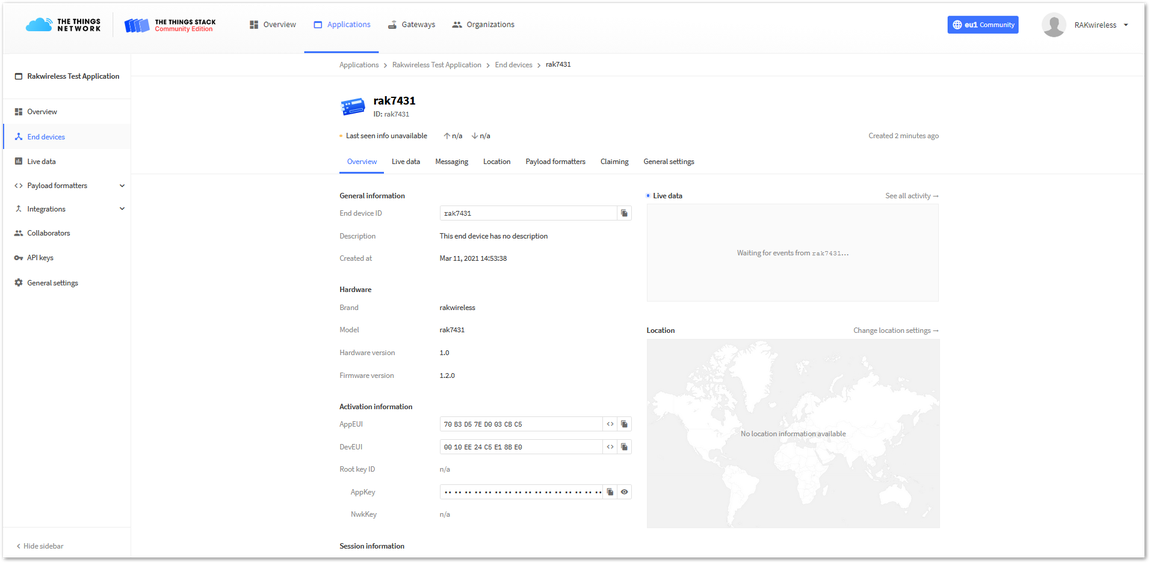 Figure 1: OTAA device parameters
- Using the RAK Serial Port Tool, set the join mode, device class, and your LoRaWAN region to your correct frequency band, with the following set of AT commands:
- For the join mode (OTAA)
AT+JOINMODE=OTAA
- For the class (Supported classes are: Class A, Class B and Class C. Remember for different classes to change the command with the correct letter, for example for Class B it will be AT+CLASS=B, in this case it is Class A.)
AT+CLASS=A
- For the region, replace the frequency band with the one for your LoRaWAN region. Refer to the TTN site for your frequency plan.
AT+REGION=EU868
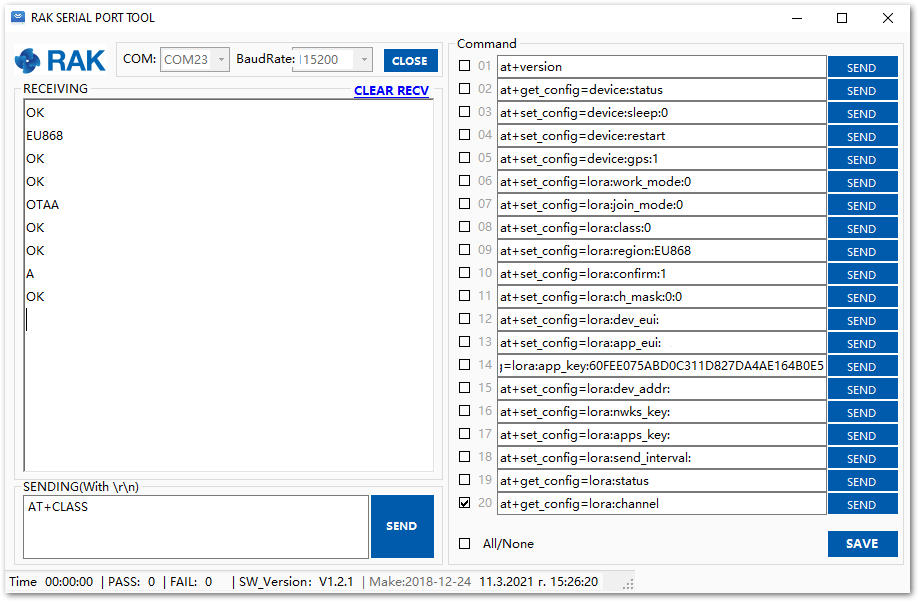 Figure 1: Setting up the RAK7431 WisNode Bridge Serial operation modes
The following tutorial is based on using the EU868 frequency band.
- Now that those parameters are set, enter the App Key, using the command below. Remember to replace the "XXXX" with the corresponding parameter value for your particular case.
AT+APPKEY=XXXX
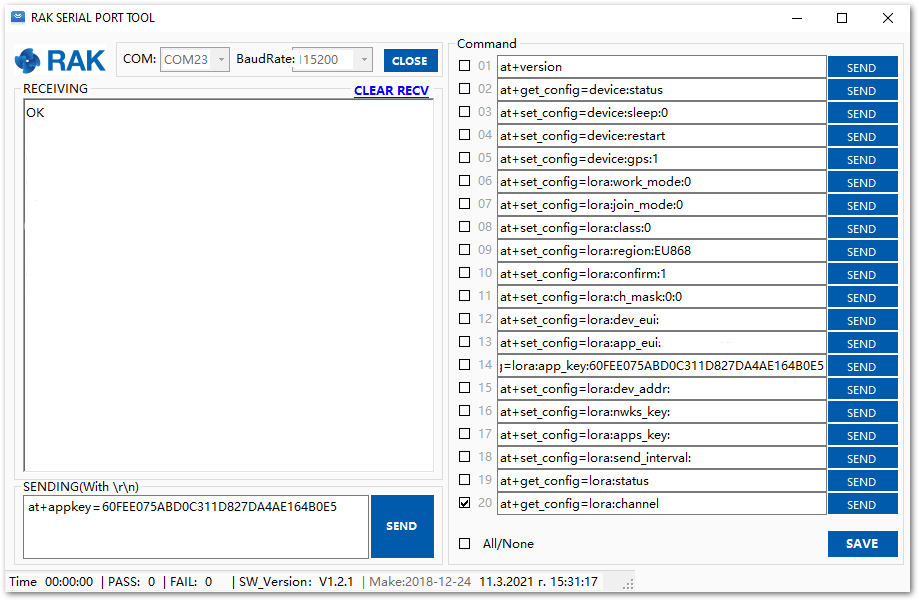 Figure 1: Setting up the RAK7431 WisNode Bridge Serial OTAA parameters
- To connect to the LoRaWAN Network after configuration, the device must be restarted. Restart it with the command:
AT+RESTART
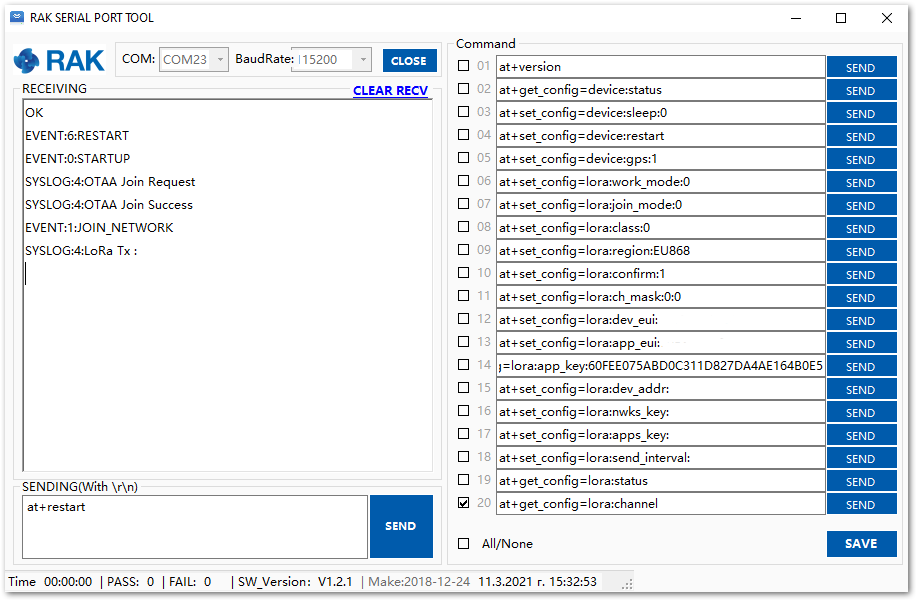 Figure 1: Joining the network confirmation
You can see in the Live data feed that the RAK7431 WisNode Bridge Serial is successfully joined.
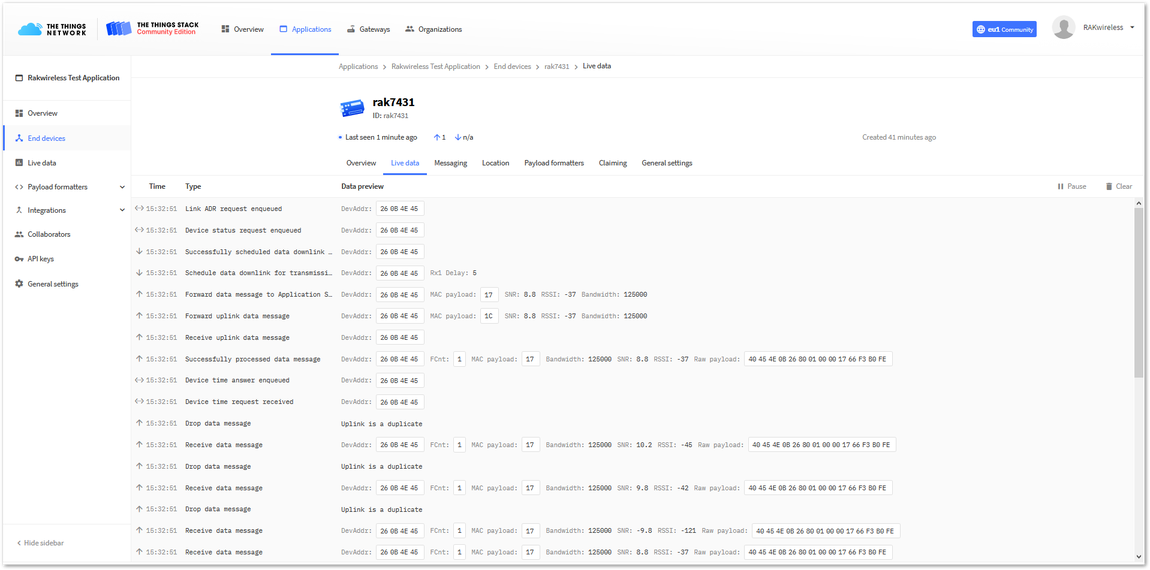 Figure 1: Receiving data in the Live data feed